

Land cover conversion and ecosystem decline
Land cover conversion through human development was listed as a leading cause of ecosystem decline in the 2014 Puget Sound Pressures Assessment, a document supported by the Environmental Protection Agency and prepared by more than 60 of the region's scientists.
 https://www.flickr.com/photos/91625873@N04/22035924720")
Overview
Ecosystem recovery should be, and often is, informed by the best available science. Typically, the source of the best available information is peer-reviewed scientific literature. However, questions often arise and major decisions must be made for which there is no vetted guidance in the scientific literature, and no time to study the issue directly. For example, among the first questions asked by recovery practitioners about an ecosystem like Puget Sound are: Of the many human pressures on the ecosystem, which present the greatest threats? And On which pressures should recovery effort be focused? Typically, answers are not to be found in technical journals, rather, they reside inside the crania of specialists and experts who are familiar with diverse components of the ecosystem. The process of carefully asking the right questions of experts, and classifying their informed answers, is known as ‘expert elicitation’. The trick is to draw opinions as objectively as possible, from as many experts as possible, and synthesize their responses as systematically as possible. While the products may not be as well-supported as, say, the results of an incisive experiment, they are infinitely superior to abject guesses, and serve very well, if by default, as the best available information.
Expert elicitation was recently used to list and rank human actions and effects that are injurious to the Puget Sound ecosystem, often referred to as “stressors”. Details of the exercise are intricate and lengthy, but it was thorough: in the end, 61 experts rated the impact of a total of 47 stressors on a total of 60 “endpoints” – the species and habitats that humans value the most, and aspire to conserve or restore. The assessment yielded scores quantifying how severely each stressor affects each endpoint. These scores were summed to yield overall rankings of stressor impact, and of endpoint vulnerability.
Results were published online in a report entitled The 2014 Puget Sound Pressures Assessment (PSPA; McManus et al., 2014), and were revealing about the relative impacts of stressors on terrestrial, freshwater, and marine environments.
Land cover conversion featured prominently among stressors with the greatest potential impacts across all environments:
- Conversion of land cover for natural resource production
- Non-point source conventional water pollutants
- Conversion of land cover for transportation & utilities
- Shoreline hardening
- Non-point source, persistent toxic chemicals in aquatic systems
Endpoints with greatest intrinsic vulnerability included:
- Cutthroat trout
- Salmon species: coho, Chinook, chum, pink, and kokanee
- Aquatic vertebrates relying on freshwater streams
Much to the relief of recovery professionals, the existing ‘Vital Signs’, selected in 2011 to serve as indicators of the general health of Puget Sound, are well represented among high-ranking stressors and endpoints in this assessment. Salmonids feature prominently among endpoints because they inhabit both marine and freshwater environments, and are therefore exposed to stressors in both. Similarly, conversion of land cover ranks highly among stressors because it includes not only agriculture and timber production, but also aquaculture (e.g. of oysters) in marine environments.
The colossal effort expended on salmon recovery, and on monitoring salmon numbers, breeding, harvest, and movements, is well known. The efforts to quantify changes in (terrestrial) land cover are not so well known, and deserve further mention here.
Estimates of land cover change
The only way to measure changes in land cover over large regions is to compare satellite images taken of the same area at different points in time, and identify ‘pixels’ that signify human-caused conversions, typically from natural vegetation to development (roads, buildings, pavement). Three studies are described here:
1. Alberti et al. (2004) assessed land cover change between 1991 and 1999 in Central Puget Sound, using Landsat (Thematic Mapper and Enhanced Thematic Mapper) imagery to distinguish seven classes: 75% impervious, 15-75% impervious, forest, grass, clear cut, bare soil, and water. Results showed that over 8 years (1991-98) urban growth produced an overall 0.84% increase in paved urban area per year, and a 0.98% increase in mixed urban areas per year. Forest cover declined by 1.03% per year over the same period.
2. Recently, Bartz et al. (2015) also used annual land cover maps created from Landsat images over 22 years (1986 to 2008) to evaluate trends in developed land cover (50100% impervious) in areas adjacent to five types of habitat utilized by Chinook salmon (O. tshawytscha) in the Puget Sound region. Increases in developed land cover adjacent to each of the habitat types were small, but consistently measurable (Table 1).

For each habitat type, the increasing trend changed during the time series. In nearshore, mainstem, and floodplain areas, the rate of increase in developed land cover slowed in the latter portion of the time series. In estuary and tributary areas the rate increased. Watersheds that were already highly developed in 1986 tended to have higher rates of development than initially less developed watersheds. Overall, results suggested that developed land cover in areas adjacent to Puget Sound salmon habitat has increased only slightly since 1986 and that the rate of change has slowed near some key habitat types, although this has occurred within the context of a degraded baseline condition. Despite an increase in human population size in the Puget Sound region of more than 1,000,000 people from 1990 to 2010 (>30% increase), developed land cover in all habitat areas increased by considerably less than 1 percentage point during approximately the same time frame.
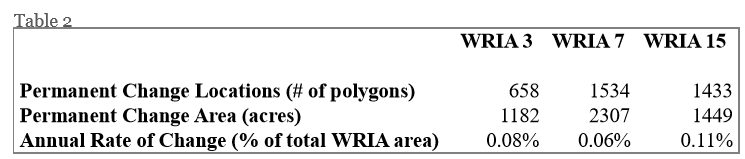
3. Pierce (2011) has done the most sophisticated analyses, using high-resolution (1m) imagery, new software, and prodigious computing power to detect changes in land cover from 2006 to 2009 in three WRIAs of the Puget Sound region: lower Skagit (WRIA 3), Snohomish (WRIA 7), and Kitsap (WRIA 15).
Results showed that rates of change with visible indications of permanent conversion were similar in the three areas (Table 2).
Comparing results from these studies is problematic because they differ in approach, data source, area, scale, and time period. While methods to detect and measure land cover change are clearly advancing in scope and sophistication, this has drawbacks, in that when methods change, it is difficult to monitor long-term trends. Ideally, observed land cover changes could be linked to data relating to issue of development permits, and thereby help to enforce Growth Management Act and Shoreline Management Plans. However, this is evidently a distant goal.
References
Alberti, M, Weeks, R., and Coe, S. (2004). Urban Land-Cover Change Analysis in Central Puget Sound. Photogrammetric Engineering & Remote Sensing, 70 (9), 1043–1052.
Bartz, K.K., Ford, M.J., Beechie, T.J., Fresh, K.L., Pess, G.R., Kennedy, R.E., et al. (2015) Trends in Developed Land Cover Adjacent to Habitat for Threatened Salmon in Puget Sound, Washington, U.S.A.. PLoS ONE 10(4): e0124415. doi:10.1371/ journal.pone.0124415.
McManus, E., Jenni, K., Clancy, M., Ghalambor, K., Logan, I., Langdon, J., Redman, S., Labiosa, W., Currens, K., Quinn, T., and Burke, J. (2014). The 2014 Puget Sound Pressures Assessment. Puget Sound Partnership Publication. Tacoma, WA.
Pierce, K. (2011) Final Report on High Resolution Change Detection Project. Unpublished.

