Keywords: Climate change, Water quality, Marine habitat, Circulation, Harmful algal blooms, Salish Sea, Hypoxia, Salish Sea Currents magazine, Marine heat waves

Years after the appearance of the devastating marine heat wave known as "the blob," scientists are still working to understand how it has affected the Salish Sea. In some ways, they say, it is like the blob never left.


The story is familiar by now, at least in some circles: Late in 2013, a patch of abnormally warm water developed in the Gulf of Alaska when the big storms that would typically mix warm and cooler water failed to materialize. The patch was massive, covering tens of thousands of square miles. On charts and graphs, it was a big red smear smack in the middle of the northeast Pacific, like an angry rash. Washington State Climatologist Nick Bond would later dub it “the blob,” and the name stuck.

Over the next couple of years, the blob would expand until it was more than one million square miles in area, covering waters from Alaska down to Mexico. Its biological impacts were diverse, widespread, and severe. Entire communities of zooplankton shifted. Fisheries were massively disrupted, as the usual species were suddenly nowhere to be found. Others normally found in the tropics suddenly appeared off of places like Oregon. Harmful algal blooms sickened food-stressed seals and sea lions. Whales starved. Millions of seabirds died. Almost no species remained untouched. All in all, the impacts were some of the most profound and devastating biologists had ever seen.

Red-orange streaks of an extensive algal bloom (Noctiluca) in Puget Sound seen during the summer of 2015. Photo: Eyes Over Puget Sound/Ecology.

Red-orange streaks of an extensive algal bloom (Noctiluca) in Puget Sound seen during the summer of 2015. Photo: Eyes Over Puget Sound/Ecology.

By the time the blob finally dissipated a couple of years later, it had been the longest marine heat wave on record. But while the havoc it wreaked on the outer coasts and open ocean has been well documented, less is known about its effects on inland waters. And as scientists around the Salish Sea are learning, in some ways it is like the blob never left.

In the Salish Sea

That the world’s oceans are warming is taken as a given, but a marine heat wave like the blob constitutes a notably extreme event. By definition, one occurs when seawater temperatures exceed a seasonally-varying threshold for at least five consecutive days. Put another way, sea temperatures bob up and down all the time within some range that is considered statistically normal, but when the temperature jumps far above those upper bounds and stays there, that is when you have a marine heat wave.

Marine heat waves are a newly noticed if not altogether new phenomenon. As Australian oceanographer Alistair Hobday showed in a paper in 2018, if you were to search the scientific literature for the phrase, you would find few results until around 2012. This was after a huge patch of warm water manifested off the coast of Western Australia for a couple of months during the austral summer of 2011. That same year, a marine heat wave developed in the northwest Atlantic Ocean, between the U.S. and Canada — the largest currently on record. Since that time, marine heat wave mentions, if you will, have risen almost exponentially, not only in scientific papers, but in the general press as well.

Such was the case during the height of the blob. “Obviously it was something that caught everyone’s attention up here in a really big way,” says Jan Newton, an oceanographer at the University of Washington who co-directs the Washington Ocean Acidification Center. “But there are a lot of details about it that we’re still working to understand.”

In the Salish Sea, scientists’ efforts to figure out the effects of the blob have been complicated in part by the relationship inland waters have with the outer coast. Ocean water enters the Salish Sea through the Strait of Juan de Fuca, but typically well below the surface. At the same time, powerful rivers from the land push water out toward the ocean. “What happens is you have a surface layer that flows outwards due to all the rivers, and a deep layer that flows inward,” Newton says. “This is because when you have something going out, it entrains water below it, and that gives you an input, like a conveyer belt.”

Circulation patterns and major sills in Puget Sound

Circulation patterns and major sills in Puget Sound. Graphic: 2007 Sound Science Report

This is further complicated by the Salish Sea’s varied and uneven seafloor. When glaciers retreated from what is now called Puget Sound thousands of years ago, they left behind elevated portions of the seafloor called sills. There is a sill at Hood Canal on the Olympic Peninsula, and a similar restriction at The Narrows by Tacoma. Admiralty Inlet has a double sill. Sills are places of turbulence: Deep water is forced up and over them, so when the fresher surface layer is moving one way and the deeper layer of oceanic water is moving the other, the deep water can rise and mix with the surface layer and get redirected. This is called reflux.

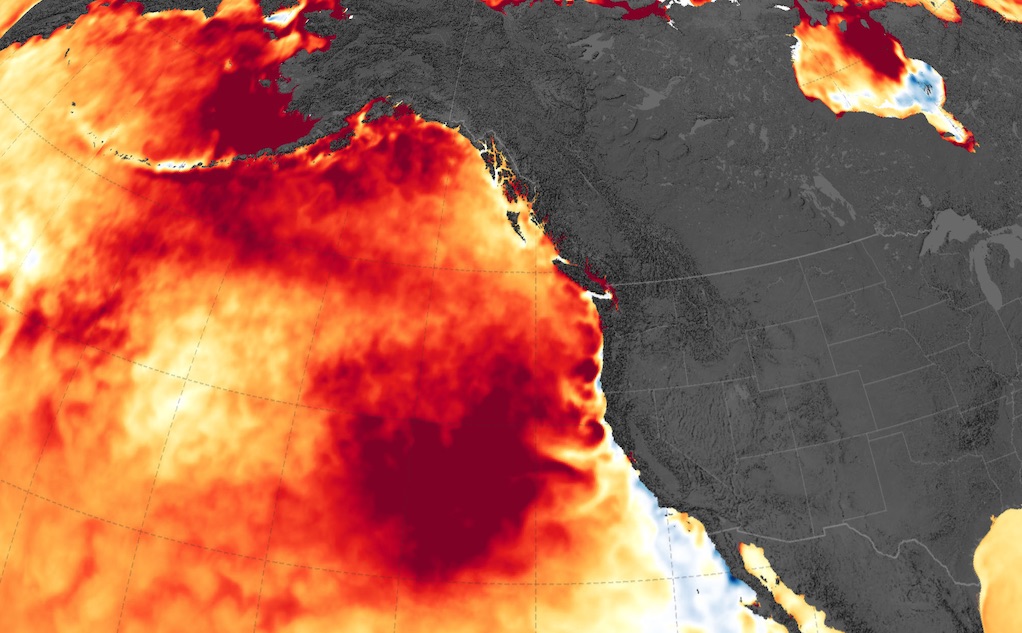
“All of this means that when seawater affected by the blob came in through Puget Sound during the first marine heat wave, some of it was retained through reflux,” Newton says. “And because the Salish Sea is shallower than the ocean on the outer coast, and we had some warmer-than-average air temperatures and ended up with some significant local heating that lasted in some cases years longer than the immediate effects of the blob on the outer coast.”

Scientists in British Columbia noticed that trend in fjords as well, where several inlets with similar seafloor features have been monitored for decades. “For these inland waters, the impact of the marine heat wave was really clear in the deep-water column,” says Jennifer Jackson, an oceanographer with the Hakai Institute. “Heat lingered from early 2015 basically up until now, and the deep water is still anomalously warm.” The sills that fronted the inlets prevented cooler ocean water from entering, effectively trapping hotter water from the blob.

When Jackson published these findings in 2018, it was one of the first papers about the effects of marine heat waves on inland waters. “Marine heat waves themselves are still a pretty new concept,” she says. “Most of what we know about them is based on the open ocean, and then on surface data or satellite data, because it’s easier to get broad coverage. But now we’re starting to learn what happens below the surface.”

Not just temperature

Additional research now coming out of the blob years has also shown that while sea temperatures may be a useful proxy for a marine heat wave’s presence, they are not the only aspect of ocean conditions affected.

Simone Alin, an oceanographer at NOAA’s Pacific Marine Environmental Laboratory in Seattle, has for more than a decade been part of a team with the Washington Ocean Acidification Center that tracked conditions in Puget Sound on research cruises in the spring, summer, and fall. Alin found that, while water column temperatures had cooled somewhat from peak-blob conditions by July 2017, they were still considerably higher than before the blob. But that was not all: Anomalies in water chemistry in the southern Salish Sea could be decoupled from the warming itself.

“When 2015 rolled around and we knew we were being hammered with a lot of heat, we were worried that since warmer water suggests you’re going to have higher rates of biological processes, it would lead to terrible conditions for oxygen and ocean acidification,” Alin says. But that wasn’t necessarily what she found. In certain places, like in southern Hood Canal, things were surprisingly better than oceanographers expected. “Areas where we saw very low oxygen and corrosive conditions in July 2015 were flushed out earlier by marine intrusions,” Alin says, “so that by the time September rolled around and you might brace yourself for fish kills, the water was actually in much better shape.”

But the flip side was also true. On a cruise in the fall of 2017, both in Puget Sound and outwards through the Strait of Juan de Fuca, researchers documented significantly elevated levels of acidification. “It wasn’t a heat signal that we were seeing compared to years previous, but still we observed very high CO2, low pH levels, and low aragonite saturation in places where we don’t normally see such harmful conditions.” At first Alin thought something was wrong with the samples, but then her team saw same thing in a second cruise around the same time. “We’re still seeing a lot of anomalies, and it’s complicated to work out how they’re related to each other, or driven by other factors,” she says. “I’ve been beating my head against a huge dataset for a few years, trying to figure out what stories I can tell because it’s so complicated.”   All of this comes as oceanographers detected another patch of warm water in the summer of 2019 off the west coast of the U.S. and Canada. It was smaller than the blob, but not by much, and it was just as warm. At the University of Washington, Jan Newton worried that it was going to slam the region still recovering from the effects of the blob. But then the patch disappeared, or seemed to, before reappearing last April.

“I don’t know if it’s technically declared a marine heat wave yet,” Newton says. “But the larger question is, is this a new normal starting to develop?” Of that she is not sure. But if it is, like so many others, she worries that the unprecedented ecological disruptions seen just a few years ago will become drearily precedented.


About the author: Eric Wagner writes about science and the environment from his home in Seattle, where he lives with his wife and daughter. His writing has appeared in Smithsonian, Orion, The Atlantic and High Country News, among other places. He is the author of "Penguins in the Desert" and co-author of "Once and Future River: Reclaiming the Duwamish." His most recent book is "After the Blast: The Ecological recovery of Mount St. Helens," published earlier this year by University of Washington Press. He holds a PhD in Biology from the University of Washington.

Series:
Implementation Strategies

Sponsored by:

United States Environmental Protection Agency logo

Creative Commons License
Story text available under a Creative Commons Attribution-NonCommercial-NoDerivs license: CC BY-NC-ND 4.0.