

In this last section, we briefly present a framework for establishing connections between potential indicators of ecosystem biophysical conditions and human well-being in Puget Sound. The framework also provides a way of characterizing existing and future studies and data that are relevant to an element of the set of potential HWB indicators.
1. Connections between biophysical and human-based indicators
Just as the Partnership’s biophysical goals can be linked to human well-being, so too can biophysical indicators. In some cases, the component tracked by a biophysical indicator is directly connected to HWB. A component such as a species, for example, can be valued for its existence, even without any direct consumptive use (e.g., harvest) or non-consumptive activity (e.g., wildlife viewing). Some of the species in Table 4, for example, have little value other than this existence value, and so a measure of some aspect of that species’ biological status could serve both as a biophysical indicator and as a normative indicator of human well-being. Estimates of WTP drawn from state preference studies that then measure existence value are one way of gauging the importance of such an ecological component. This provides a means of identifying a potentially useful indicator, independent of its qualities as a biophysical indicator.
At the other extreme, human well-being is sometimes derived purely from the direct consumption or harvest of an ecological component. The level and value of that use can be used as a normative HWB indicator, easily expressed in dollars if the use takes place in a market setting. In such a case, an indicator that tracks the actual level of consumption or harvest provides information on actual HWB, while an indicator that tracks the biological status of the ecological component provides information on potential future HWB.
This case presents an interesting complication that illustrates some of the nuances involved in introducing HWB into ecosystem-based management. Fishing provides an example relevant to Puget Sound. The harvest of a fish population is an activity that supports HWB, and so an indicator based on harvest levels is one that faithfully tracks HWB. If the harvest rate is unsustainably high, however, an indicator that tracks the status of the fish population will trend downward, which seemingly indicates a decline in HWB.
(For the purposes of this simple example, we assume that the fishery is “mature” in that the initial stock is at or below the level that would produce the maximum sustainable yield or growth rate. In that case, a harvest level greater than the growth rate is one that will lower the stock size and its growth rate, accelerating the stock’s decline.)
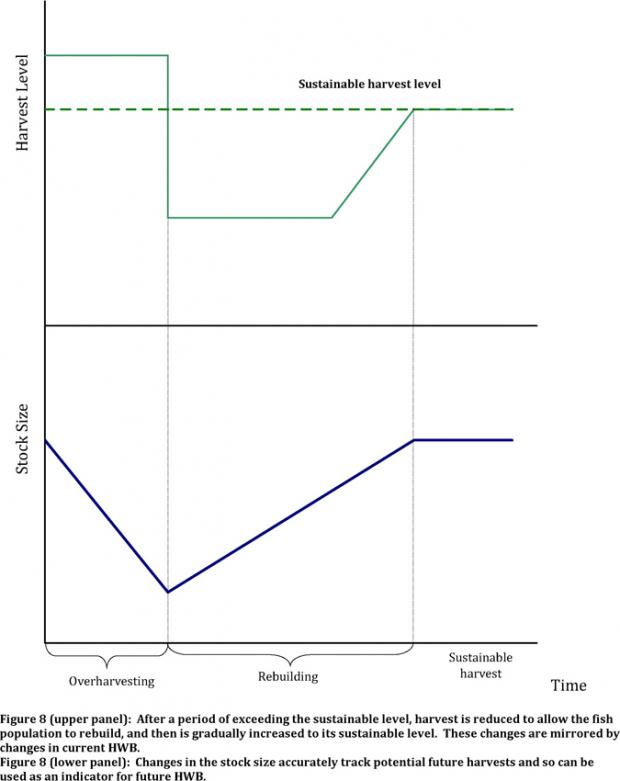
How should these conflicting signals be interpreted? If a conservation action consists of rebuilding the fish population with a period of lowered harvest levels, both indicators will accurately reflect the effects of this action on HWB. In Figure 8 (top panel), the harvest level is initially above the sustainable level for the initial stock size, which we assume is the desired or target population level. HWB is correspondingly high, but not at a level that can be sustained indefinitely. At some point, restrictions on harvest are imposed for the purpose of rebuilding the stock. These restrictions reduce the current level of HWB, which then increases assuming the rebuilding period at some point allows harvest to increase gradually. Finally, harvest is maintained at a sustainable level after the stock is rebuilt, and (in this simplistic world) can be maintained at that level indefinitely.
The current level of HWB faithfully tracks the harvest level throughout these periods, and so a normative HWB indicator can be developed based on annual harvests. At the same time, the fish population dynamics foretell future HWB. In Figure 8 (bottom panel), the stock size decreases during the period of overharvesting to levels significantly below its initial, target level. During the rebuilding period, it increases, eventually reaching the target level, where it can be maintained indefinitely as long as the harvest level is sustainable. Again, these movements are faithful predictors of future HWB, and so a normative HWB indicator can be based on its level, recognizing that the information embedded in such an indicator is partly dependent on how the system is managed. This example underscores the complexities in interpreting biophysical indicators in terms of HWB, given the dynamic nature of ecosystems and the potential of natural capital to support current and future HWB.
In other cases, connections exist between ecological and human systems that support HWB along even more complicated pathways. Understanding these pathways is important to identifying potential indicators, evaluating their qualities, and understanding how to relate changes in their levels to changes in HWB. For example, the harvest example illustrated in Figure 8 focuses only on the HWB derived from the connection between a fish population and its harvest by humans. Such a population can be valued along multiple pathways, however, some of which are complementary to harvest while others potentially involve tradeoffs.
For example, Puget Sound coho salmon populations provide opportunities for recreational and commercial fisheries, some of which are conducted by Puget Sound tribes (Pacific Marine Fisheries Council, 2010, Tables B-39 and B-41). They are also prey for bald eagles (Stinson et al., 2007), an iconic species that has considerable economic value for wildlife viewing and existence value (Boyle and Bishop, 1987; Stevens et al., 1991; Swanson, 1996). In the Skagit River basin, coho populations have experienced a loss in spawning and rearing habitat due to economic activities such as flood control, agriculture, and other activities (Stinson et al., 2007). Focusing on agriculture, we note that the Partnership has identified it as a “Low Threat” to ecosystem health (Puget Sound Partnership, 2009c). The Partnership has also identified “locally-grown food” in its Action Agenda as part of its five primary objectives, under the qualification that its production be “consistent with ecosystem protection” (Puget Sound Partnership, 2008). The cost and quality of agricultural production is an obvious contributor to HWB, as evidenced by its market value; moreover, there is some evidence that locally-produced food can command a higher WTP, other characteristics constant Darby et al., 2008). All of these connections create a complex set of pathways between potential biophysical and human-based indicators, and between those indicators and potential management actions (Figure 9).
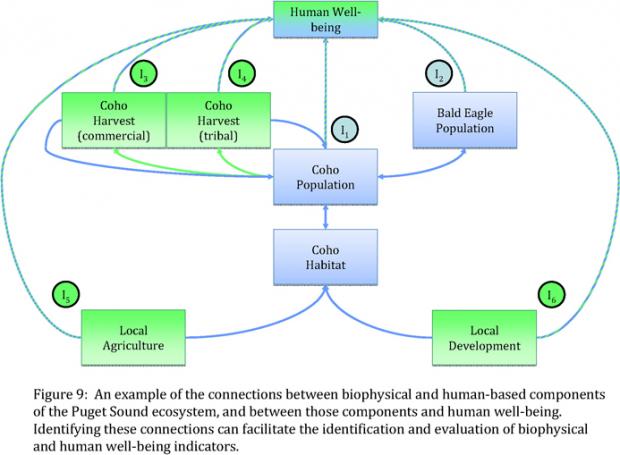
In this system, HWB indicators could be based on
- Coho and bald eagle populations (I1 and I2). Bell et al. (2003) used a stated preference survey to determine the WTP for a local coho salmon enhancement program in four Washington and Oregon coastal estuaries. They estimate this WTP to range between $37 and $120, depending on a household’s income and the type of program. Swanson (1996) used a stated preference survey to determine the WTP of visitors to the Skagit River Bald Eagle Natural Area for bald eagle preservation. She found that visitors were willing to pay up to $350 for a 3005 increase in their population.
- Commercial Puget Sound coho harvest (all sources) and commercial, ceremonial, and subsistence tribal Puget Sound coho harvest levels (I3 and I4). As noted before in Table 2, Puget Sound coho populations are a valuable market commodity.
- Locally-based agricultural production (I5). Darby et al. (2008) used a stated preference survey to address whether consumers place a premium on “local” food distinct from other agricultural characteristics such as product freshness. They found that “local” does command a premium but found no difference between “in state” and “nearby” as the relevant geography for “local”.
- Local development (I6). Because human well-being is supported by myriad forms of capital, not just natural capital (Millennium Ecosystem Assessment, 2005), measuring the contribution of land development to HWB and utilizing an appropriate indicator are important for EBM. This is an area for future work.
For broader purposes, one could use this approach for identifying connections and potential indicators to refine the Partnership’s development of objectives and performance measures based on the Open Standards framework and its results chains (Puget Sound Partnership, 2009d).
2. Summary
Assessing the strength of connections between HWB and biophysical or human-based components of the ecosystem provides some guidance for EBM, then, in several ways. First, where sufficient evidence exists to indicate the strength of a connection, using any of the approaches described in the previous section, such evidence can highlight potential indicators associated with relatively strong connections. Second, the evidence can at least give some insights into the overall effect on HWB in cases where proposed management actions have multiple effects and potential tradeoffs. The evidence might indicate where such tradeoffs are likely to be “one-sided,” in the sense of one value or connection being significantly stronger than any other; or it might indicate where such tradeoffs might be “closer,” in that they involve multiple connections with some value but which move in opposite directions in response to a proposed action. And finally, collecting and cataloging evidence of this sort can highlight the (unfortunately many) areas where evidence is sparse, particularly for the connections among biophysical conditions, human behavior and values, and overall human well-being in the Puget Sound region. This can help set priorities for future social science research to support the Puget Sound Partnership’s mission.
|
Key Points: The evidence on connections between environmental conditions and human well-being can be used to identify and evaluate potential indicators for the Puget Sound Partnership. Some biophysical indicators can also serve as human well-being indicators, or can be used in conjunction with HWB indicators to which they are connected. Evidence drawn from studies on HWB and environmental conditions can be used to assess the potential importance of the connections between the two, and so provide the Partnership with guidance on choosing relevant indicators. |
References
Bell, K.P, D. Huppert and R.L. Johnson. 2003. Willingness to pay for local coho salmon enhancement in coastal communities. Marine Resource Economics 18: 15–31.
Boyle, K. and R. Bishop. 1987. Valuing wildlife in benefit–cost analysis: a case study involving endangered species, Water Resources Research 23: 943–950.
Darby, K., M.T. Batte, S. Ernst, and B. Roe. 2008. Decomposing Local: A Conjoint Analysis of Locally Produced Foods. American Journal of Agricultural Economics 90: 476-486.
Millenium Ecosystem Assessment. 2005. Linking ecosystem services and human well-being. In: Capistrano, D., C.K. Samper, M.J. Lee, and C. Raudsepp-Hearne, eds. Ecosystem and Human Well-being: Multiscale Assessment. Island Press, Washington, D.C. pp. 45–60.
Puget Sound Partnership. 2008. Puget Sound Action Agenda, Protecting and Restoring the Puget Sound Ecosystem by 2020, Olympia, WA.
Puget Sound Partnership. 2009c. Identification, Definition and Rating of Threats to the Recovery of Puget Sound, Technical Memorandum, Olympia, WA.
Puget Sound Partnership. 2009d. Using Results Chains to Develop Objectives and Performance Measures for the 2008 Action Agenda, Technical Memorandum, Olympia.
Stevens T., J. Echeverria, R. Glass, T. Hager, and T. More. 1991. Measuring the existence value of wildlife: what do CVM estimates really show? Land Economics 67: 390–400.
Stinson, D.W., J.W. Watson, and K.R. McAllister. 2007. Washington State Status Report for the Bald Eagle. Washington Department of Fish and Wildlife, Olympia. 86 + viii pp.
Swanson, C.S. 1996. Economics of Endangered Species: Bald Eagles on the Skagit River Bald Eagle Natural Area, Washington. Transactions of the 61st North American Wildlife and Natural Resources Conference 61: 293-300.

