

Salmonids in Puget Sound
Fish in the family Salmonidae (salmon, trout, and charr) play potentially integral roles in the upland freshwater, nearshore and pelagic marine ecosystems and food webs of Puget Sound.
. Image courtesy U.S. Fish and Wildlife Service.")
Salmonids are unique in their cultural, economic and ecological role in Puget Sound, and provide key trophic links between habitats through their migratory behavior. While there is much variation in the behavior and ecology within and among the different salmonid species in Puget Sound, they typically use freshwater habitats to spawn, after which juveniles emerge and eventually migrate to nearshore estuaries or directly to marine pelagic habitats. Salmonids spend up to several years in marine habitats prior to returning to their natal watershed to spawn. Each life phase is thus dependent on a different suite of abiotic and biotic processes for survival. The use of nearshore habitats by juvenile salmon is thought to be a critical aspect of their capability to ultimately return and spawn (Fresh 2006). Available spawning habitat, appropriate water temperature and flow, and oceanic conditions are also important for salmonid survival and the degree of use of each type of habitat varies dramatically across the salmonid species.
The watersheds and nearshore habitats of Puget Sound currently support 8 species of salmon, trout, and charr (NOAA 2007)(Figure 1), four of which are listed as Threatened under the Endangered Species Act (ESA). These are Chinook salmon (Oncorhynchus tshawytscha), chum salmon (O. keta), bull trout (Salvelinus confluentus) and steelhead (O. mykiss). The recovery plan for Chinook, Hood Canal Summer Chum and bull trout put forth by Shared Strategy for Puget Sound and the Puget Sound Technical Recovery Team was adopted by NOAA Fisheries in 2007. The recovery strategy for these species is based upon the underlying principles of 1) abundance (the number of spawners); 2) productivity (the number of returning fish produced by each spawner); 3) spatial distribution (the geographic distribution of fish populations); and 4) diversity (of the genetic, physiological and morphological attributes)(NOAA 2007).
Data are collected on salmonid abundances in Puget Sound by a variety of local, state and federal agencies including Washington Department of Fish and Wildlife(WDFW), NOAA Fisheries and the US Fish and Wildlife Service. Spawner abundances are typically estimated in the field by counting the number of nests (redds) or by counting the number of spawning and/or dead fish. WDFW maintains an online database of watershed-specific spawner abundances (Salmonscape) and also conducts stock status estimates (Salmonid Stock Inventory) whereby each spawning stock is designated as Healthy, Depressed, Critical, Extinct or Unknown based upon recent abundance trends for all species except for Chinook salmon (WDFW 2002). The most recent stock inventory categorization utilized trend data from the mid 1980s to 2000 or 2001 (WDFW 2002).
Chinook salmon
. Image courtesty U.S. Fish and Wildlife Service.")
The largest of the salmonids, Chinook salmon typically spawn in larger rivers and their tributaries, utilizing deeper water and larger gravel for egg burial than their congeners. While Chinook fry are often classified as either ocean-type or stream-type depending on the timing of their initial downstream migration, in Puget Sound this has further been subdivided into four broad types of strategies based upon general timing emigration from both freshwater and estuarine habitats prior to eventually migrating to coastal oceanic waters (Fresh 2006). These range from up to a year spent in natal freshwater streams with very little time spent migrating through estuarine habitat to very early emigration from freshwater with up to 120 days spent rearing in natal estuaries and tidal wetlands (summarized in Fresh 2006). This diversity is thought to be critical for the continued survival of this species (NOAA 2007). There is emerging evidence that some Chinook salmon remain in Puget Sound waters as residents with little or no time spent in oceanic waters (O'Neill and West 2009). Following entry into the open ocean via the Strait of Juan de Fuca, Chinook salmon are believed to migrate mostly northwards towards British Columbia and Alaska, remaining on the continental shelf where they typically spend 2-4 years before returning to their natal stream to spawn and die (Quinn 2005, Quinn et al. 2005).
Hood Canal Summer Chum salmon
Chum salmon typically spawn in the lower reaches of rivers with fry leaving fresh water for estuarine habitats within days of emergence. In Puget Sound, they can either remain in their natal estuaries or transition to other estuaries and nearshore habitats to rear before entering oceanic waters. While utilizing estuary habitats, chum salmon primarily feed upon epibenthic invertebrates associated with eelgrass (summarized in Fresh 2006).
Steelhead
. Image by Robert Hines. Courtesy U.S. Fish and Wildlife Service.")
Unlike Chinook and chum salmon, steelhead are iteroparous, displaying a diverse suite of life history variations with variable time spent in fresh, salt water and estuarine environments. They are thought to leave coastal waters immediately after entering the ocean, occupying marine habitats distinct from that of their congeners, spending 1-3 years at sea (Quinn et al. 2005, Hard et al. 2007). While little is known about the oceanic migration patterns of Puget Sound steelhead, there is evidence that they travel to the Central North Pacific (reviewed in Hard et al. 2007). The resident (non-migratory) form of steelhead (rainbow trout) is also present in Puget Sound (Hard et al. 2007).
Bull trout
. Photo by Joel Sartore, U.S. Fish and Wildlife Service.")
Like steelhead, Bull trout are iteroparous and long lived, potentially spawning in their natal streams several times throughout their lifetime. Like cutthroat trout, bull trout often occupy nearshore marine habitats during their short seaward migration.
Status
Chinook salmon
Listed as Threatened in 1999, Chinook salmon currently maintain 22 of the estimated 30-37 historically present spawning populations that utilize rivers and streams throughout Puget Sound. (NOAA 2007)(Figure 1, Table 1). Many of the populations lost were those that spawned earlier in the spawning season when water levels are typically lower and temperatures are higher (NOAA 2007). There is also evidence that the life history variants that spend the greatest time in freshwater (stream-type) have been severely reduced in recent years, likely because these variants are particularly susceptible to watershed alteration such as damming (Beechie et al. 2006). Furthermore, the few remaining locations where the stream-type life history has persisted appear to be largely dependent on snowmelt for their water and thus may be particularly susceptible to the effects of global climate change (Beechie et al. 2006). The Puget Sound Technical Recovery Team (PSTRT) estimated the historic spawner abundances by modeling the number of individuals each watershed could support based upon habitat characteristics (NOAA 2007). For all populations for which this analysis has been conducted, current population levels are substantially less than the estimated historic levels (NOAA 2007)(Figure 2).

Figure 1. Map of major watersheds in Puget Sound utilized by salmonids (Reprinted from NOAA 2007; courtesy of NOAA Fisheries).
Table 1. Extant populations of Chinook salmon in Puget Sound (NOAA Salmon Recovery Plan 2007).
| Geographic Region | Populations Remaining |
Strait of Georgia This area includes the Nooksack River and the San Juan Islands. It is an area greatly influenced by the Fraser River and is utilized extensively for forage and migration by many Puget Sound populations. | North Fork Nooksack South Fork Nooksack |
Strait of Juan de Fuca This region includes the rivers draining the north slopes of the Olympic mountains, and draining into the eastern Strait of Juan de Fuca. Nearshore areas along the Strait are considered to be a major migratory corridor. | Elwha Dungeness |
Hood Canal The east face of the Olympic mountain range and small streams along the western Kitsap Peninsula drain into this distinct estuary. | Skokomish Mid Hood Canal (incl. Dosewallips, Duckabush and Hamma Hamma) |
Whidbey Basin The Whidbey basin is the main estuarine area for the major Chinook-producing rivers in Puget Sound, and the migratory crossroads for most Puget Sound populations. | Skykomish Snoqualmie North and South Fork Stillaguamish Upper and Lower Skagit Upper and Lower Sauk Suiattle Cascade |
Central/South Basin These basins were combined into a single geographic unit largely to reflect correlated risks from volcanic activity and urban-related effects. | Cedar River North Lake Washington Green/Duwamish Puyallup White Nisqually |
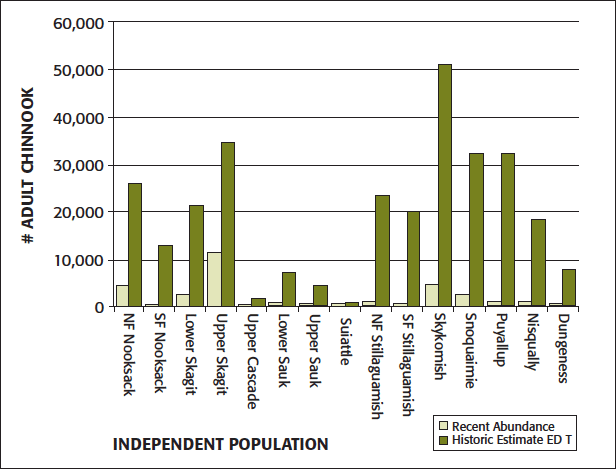
Figure 2. Comparison of recent (2000-2004) geometric mean of naturally spawning Puget Sound Chinook populations to estimates of historic capacity of in some Puget Sound watersheds using Ecosystem Diagnostic and Treatment (EDT) habitat models (Reprinted from NOAA Salmon 2007; courtesy of NOAA Fisheries).
Hood Canal Summer Chum
The summer run of Hood Canal chum salmon was listed as Threatened in 1999. A primary factor in this designation was the recognition that this stock comprises an important and distinct life history strategy within the species (NOAA 2007). Of the 16 historic spawning stocks of Hood Canal summer chum, eight are extant (NOAA 2007)(Table 2). In a recent review of this Threatened Evolutionarily Significant Unit (ESU), two genetically distinct populations were identified: a Strait of Juan de Fuca population (which includes the extant spawning aggregations Jimmycomelately, Snow, Salmon and Chimacum creeks) and a Hood Canal population (which includes the extant spawning aggregations Big and Little Quilcene, Dosewallips, Duckabush, Hamma Hamma, Union and Lilliwaup watershds)(Sands et al. 2009)(Figure 3). Maintaining diversity within and between these newly two newly identified populations will now be incorporated into the recovery goals for Hood Canal Summer Chum (Sands et al. 2009).
Table 2. Current (extant) and extinct populations of Hood Canal summer chum and supplementation/reintroduction programs (NOAA Salmon Recovery Plan 2007).
| Population | Status | Supplementation/Reintroduction |
| Union River | Extant | Supplementation program began in 2000 |
| Lilliwaup Creek | Extant | Supplementation program began in 1992 |
| Hamma Hamma River | Extant | Supplementation program began in 1997 |
| Duckabush River | Extant | --- |
| Dosewallips River | Extant | --- |
| Big/Little Quilcene River | Extant | Supplementation program began in 1992 |
| Snow/Salmon Creeks | Extant | Supp. Program began in 1992 in Salmon |
| Jimmycomelately Creek | Extant | Supplementation program began in 1999 |
| Dungeness River | Unknown | --- |
| Big Beef Creek | Extinct | Reintroduction program began in 1996 |
| Anderson Creek | Extinct | --- |
| Dewatto Creek | Extinct | Natural re-colonization occurring |
| Tahuya River | Extinct | --- |
| Skokomish River | Extinct | --- |
| Finch Creek | Extinct | --- |
| Chimacum Creek | Extinct | Reintroduction program |
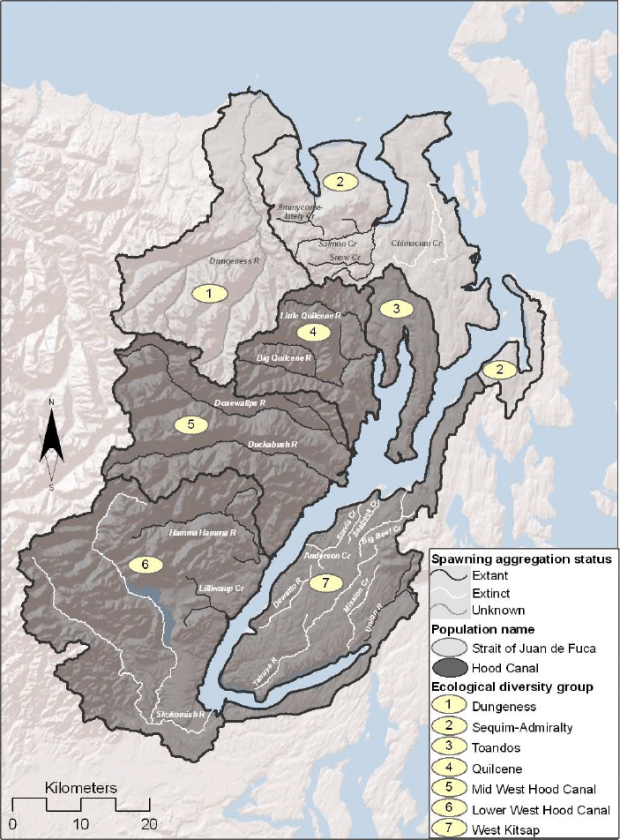
Figure 3. The two populations of the Hood Canal Summer Chum salmon ESU, including streams with spawning aggregations and seven ecological diversity groups (Reprinted from Sands et al. 2009; courtesy of NOAA Fisheries).
Steelhead
Steelhead in the Puget Sound ESU were federally listed as Threatened in 2007 (Hard et al. 2007). WDFW currently lists 53 spawning populations of steelhead in Puget Sound, the majority of which return in the winter to spawn. Less well studied and less abundant, the remaining populations return in the summer and are typically found in the northern portions of Puget Sound (Hard et al. 2007). The two largest populations of winter steelhead are also in the northern part of the sound, in the Skagit and Snohomish rivers (Hard et al. 2007)(Table 3).
Table 3. Geometric mean estimates of escapements of Puget Sound populations for all years of data (from ca. 1980 – 2004 for most populations) and for the 5 most recent years (2000 – 2004). Estimates are based on hatchery and natural spawner (H+N columns) or only on natural spawners (N columns). Hatchery fish are not included in the Puget Sound ESU. NPS = Northern Puget Sound, SPS = Southern Puget Sound, HC = Hood Canal, SJF = Strait of Juan de Fuca, SSH = summer run steelhead, WSH = winter run steelhead, N/A = data not available (Hard et al. 2007).
| Region | Run Type | Population | H+N, all years | H+N, 5 years | N, all years | N, 5 years |
| NPS | SSH | Canyon | N/A | N/A | N/A | N/A |
| NPS | SSH | Skagit | N/A | N/A | N/A | N/A |
| NPS | SSH | Snohomish | N/A | N/A | N/A | N/A |
| NPS | SSH | Stillaguamish | N/A | N/A | N/A | N/A |
| NPS | WSH | Canyon | N/A | N/A | N/A | N/A |
| NPS | WSH | Dakota | N/A | N/A | N/A | N/A |
| NPS | WSH | Nooksack | N/A | N/A | N/A | N/A |
| NPS | WSH | Samish | 684.2 | 852.2 | 500.8 | 852.2 |
| NPS | WSH | Skagit | 7,720.4 | 5,608.5 | 6,993.9 | 5,418.8 |
| NPS | WSH | Snohomish | 5,283.0 | 3,230.1 | 5,283.0 | 3,230.1 |
| NPS | WSH | Stillaguamish | 1,027.7 | 550.2 | 1,027.7 | 550.2 |
| NPS | SSH | Tolt | 129.2 | 119.0 | 129.2 | 119.0 |
| SPS | SSH | Green | N/A | N/A | N/A | N/A |
| SPS | WSH | Cedar | 137.9 | 36.8 | 137.9 | 36.8 |
| SPS | WSH | Green | 2,050.6 | 1,625.5 | 1,802.1 | 1,619.7 |
| SPS | WSH | Lk. Washington | 247.1 | 36.8 | 308.0 | 36.8 |
| SPS | WSH | Nisqually | 1,136.7 | 392.4 | 1,115.9 | 392.4 |
| SPS | WSH | Puyallup | 1,1881.5 | 1,001.0 | 1,714.4 | 907.3 |
| HC | WSH | Dewatto | 27.0 | 24.7 | 24.0 | 24.7 |
| HC | WSH | Dosewallips | 70.6 | 76.7 | 70.6 | 76.7 |
| HC | WSH | Duckabush | 16.6 | 17.7 | 16.6 | 17.7 |
| HC | WSH | Hamma Hamma | 29.6 | 51.9 | 29.6 | 51.9 |
| HC | WSH | Quilcene | 16.8 | 15.1 | 16.8 | 15.1 |
| HC | WSH | Skokomish | 439.3 | 202.8 | 439.3 | 202.8 |
| HC | WSH | Tahuya | 131.8 | 117.0 | 113.9 | 117.0 |
| HC | WSH | Union | 57.1 | 55.3 | 55.0 | 55.3 |
| SJF | SSH | Elwha | N/A | N/A | N/A | N/A |
| SJF | WSH | Dungeness | 311.2 | 173.8 | 311.2 | 173.8 |
| SJF | WSH | Elwha | 459.5 | 210.0 | N/A | N/A |
| SJF | WSH | McDonald | N/A | N/A | 149.8 | 96.1 |
| SJF | WSH | Morse | 132.6 | 103.0 | 105.8 | 103.0 |
Bull trout
Bull trout in Washington, including the Puget Sound Distinct Population Segment (DPS), were also listed as Threatened in 1999. The US Fish and Wildlife Service conducted an analysis of vulnerability to stochastic events across the spawning stocks of bull trout in Puget Sound, finding the Snohomish/Skyhomish, the Stillaguamish, and the Chester Morse Lake spawning stocks to be at the greatest risk (NOAA 2007)(Table 4).
Table 4. Bull trout risk levels for watersheds in Puget Sound (USFWS data)(NOAA Salmon Recovery Plan 2007)
| Core Areas | Local and Potential Local Populations | Information on Abundance, Trends and Distribution | Risk from Stochastic Events |
Chilliwack | Little Chilliwack River | Chilliwack Lake is an important source of rearing and forage for most local populations. | Intermediate risk if only the US populations are considered. Diminished risk if both US and Canadian populations are considered. |
Upper Chilliwack River | |||
Selesia Creek (British Columbia & US) | |||
Depot Creek (BC & US) | |||
Airplane Creek (BC) | |||
Borden Creek (BC) | |||
Centre Creek (BC) | |||
Foley Creek (BC) | |||
Nesakwatch Creek (BC) | |||
Paleface Creek (BC) | |||
Nooksack | Lower Canyon Creek | Spawning occurs in all three forks of the Nooksack River and its tributaries. Fewer than 1000 spawners; most local populations have less than 100 adults. | Intermediate Risk |
Glacier Creek | |||
Lower Middle Fork Nooksack R | |||
Upper MF Nooksack River | |||
Lower North Fork Nooksack R | |||
Middle NF Nooksack River | |||
Upper NF Nooksack River | |||
Upper South Fork Nooksack R | |||
Lower SF Nooksack River | |||
Wanlick Creek | |||
Lower Skagit | Bacon Creek | Bull trout are known to spawn and rear in at least 19 streams/stream complexes. This core area supports a spawning population of migrating bull trout numbering in the thousands. Connectivity and diversity of habitats are excellent except portions modified by dams. High abundance of pink salmon for forage. | Diminished Risk |
Baker Lake | |||
Buck Creek | |||
Cascade River | |||
South Fork Cascade River | |||
Downey Creek | |||
Goodell Creek | |||
Illabot Creek | |||
Lime Creek | |||
Milk Creek | |||
Newhalem Creek | |||
Forks of Sauk River | |||
Upper South Fork Sauk River | |||
Straight Creek | |||
Upper Suiattle River | |||
Sulphus Creek | |||
Tenas Creek | |||
Lower White Chuck River | |||
Upper White Chuck River | |||
Sulphur Creek-Lake Shannon (potential local population) | |||
Stetattle Creek-Gorge Lake (potential local population) | |||
Upper Skagit | Big Beaver Creek | Populations are well distributed. British Columbia portion presumed healthy; status is generally unknown. 2 areas of concern due to lack of connectivity: Diablo Lake and Gorge Lake. | Intermediate risk if only the US populations are considered. Diminished risk if both US and Canadian populations are considered. |
Little Beaver Creek | |||
Lightning Creek | |||
Panther Creek | |||
Pierce Creek | |||
Ruby Creek | |||
Silver Creek | |||
Thunder Creek (Diablo Lake) | |||
Deer Creek (Diablo Lake) (potential local population) | |||
Skagit River (BC) | |||
East Fork Skagit River (BC) | |||
Klesilkwa River (BC) | |||
Nepopekum Creek (BC) | |||
Skaist River (BC) | |||
Sumallo River (BC) | |||
Stillaguamish | Upper Deer Creek | Few known spawning areas. Fewer than 1000 spawners; most local populations have less than 100 adults. Snorkel surveys have found greater than 100 adults in the North Fork Stillaguamish R. | Increased risk |
South Fork Canyon Creek | |||
North Fork Stillaguamish River | |||
South Fork Stillaguamish River | |||
Snohomish-Skykomish | number of adult spawners is 500-1000. System has no lakes. Large portion of migratory segment are anadromous. North Fork Sky considered healthy by WDFW with 470-650 individuals on average, based on redd counts. South Fork Sky considered healthy by WDFW due to increasing numbers, and recolonization is occurring. | Increased risk | |
South Fork Skykomish River | |||
Salmon Creek | |||
Troublesome Creek (primarily a resident population) | |||
Chester Morse Lake | Boulder Creek | Area has few known spawning areas. Surveys in 2000-2002 documented 236-504 redds, with estimated 500-1000 spawners. Upper Cedar River and Rex River are the primary local populations in this core area. Upper Cedar River is the only known self-sustaining population in the Lake WA basin. | Increased risk. |
Upper Cedar River | |||
Rex River | |||
Rack Creek | |||
Shotgun Creek (potential local population) | |||
Puyallup | Carbon River | Fewer than 1000 spawners; most local populations have less than 100 adults. Known spawning areas are few and not widespread. Area has a low number of local populations. Portions within the National Park and wilderness area provide pristine habitat. | Intermediate risk |
Greenwater River | |||
Upper Puyallup and Mowich Rivers | |||
Upper White River | |||
West Fork White River | |||
Clearwater River (potential local population) |
Trends
Chinook salmon
An analysis of 5-year population growth trends for Chinook salmon from 1986 - 2004 was conducted by NOAA fisheries. Of those populations that had been declining from 1986 – 1990, many exhibited positive growth over 1994 – 1998. (NOAA 2007) (Table 5). While productivity was not calculated for the most recent time period (2000-2004), the population means for this period were, in many cases, higher than that observed previously (NOAA 2007)(Table 5). Despite this positive trend, many populations remained low, including the Dungeness River and Skokomish spawning stocks (NOAA 2007)(Table 5).
Table 5. Geometric mean (5 year periods) of spawning abundances, hatchery contribution and productivity (number of return spawners per parent spawner) in Puget Sound Chinook Populations (NOAA Salmon Recovery Plan 2007).
| 1986-1990 | 1994-1998 | 2000-2004 | ||||||
| Populations | Geometric Mean | %Hatchery Contribution | Productivity | Geometric Mean | %Hatchery Contribution | Productivity | Geometric Mean | %Hatchery Contribution |
| North + Middle Fork Nooksack | 140 | 21% | 1.29 | 263 | 67% | 0.45 | 4,232 | 94% |
| South Fork Nooksack | 243 | 7% | 0.60 | 181 | 35% | 1.20 | 303 | 46% |
| Lower Skagit | 2,732 | 1% | 0.59 | 974 | 1% | 3.15 | 2,597 | 2% |
| Upper Skagit | 8,020 | 2% | 0.69 | 6,388 | 1% | 1.60 | 12,116 | 4% |
| Upper Cascade | 226 | 0% | 0.88 | 241 | 0% | 1.34 | 355 | 1% |
| Lower Sauk | 888 | 0% | 0.61 | 330 | 0% | 2.35 | 825 | 0% |
| Upper Sauk | 720 | 0% | 0.57 | 245 | 0% | 1.35 | 413 | 0% |
| Suiattle | 687 | 0% | 0.40 | 365 | 0% | 1.20 | 409 | 0% |
| North Fork Stillaguamish | 699 | 0% | 0.92 | 862 | 35% | 0.94 | 1,176 | 31% |
| South Fork Stillaguamish | 257 | 0% | 1.31 | 246 | 0% | 1.22 | 205 | 0% |
| Skykomish | 3,204 | 14% | 0.52 | 3,172 | 52% | 0.82 | 4,759 | 39% |
| Snoqualmie | 907 | 12% | 1.23 | 1,012 | 33% | 1.68 | 2,446 | 14% |
| Sammammish | 388 | 41% | 0.28 | 145 | 74% | 2.72 | 243 | 69% |
| Cedar | 733 | 9% | 0.51 | 391 | 17% | 0.97 | 412 | 21% |
| Green/Duwamish | 7,966 | 62% | 0.50 | 7,060 | 71% | 1.00 | 13,172 | 34% |
| White | 73 | 56% | 7.51 | 452 | 82% | 1.49 | 1,417 | 28% |
| Puyallup | 1,509 | 15% | 1.86 | 1,657 | 40% | 0.67 | 1,353 | 31% |
| Nisqually | 602 | 3% | 4.22 | 753 | 21% | 1.38 | 1,295 | 25% |
| Skokomish | 1,630 | 69% | 0.48 | 866 | 69% | 0.34 | 1,479 | 80% |
| Mid Hood Canal | 87 | 26% | 1.41 | 182 | 26% | 1.31 | 202 | 46% |
| Dungeness | 185 | 83% | 0.12 | 101 | 83% | 0.70 | 532 | 83% |
| Elwha Nat Spawners | 2,055 | 34% | 0.46 | 512 | 61% | 1.03 | 847 | 54% |
| Elwha Nat+Hat Spawners | 3,887 | 34% | 0.67 | 1,679 | 61% | 1.27 | 2,384 | 54% |
Hood Canal Chum salmon
Population growth rates for Hood Canal summer chum salmon were all positive over short- time frames (1999-2002), but only two of the eight spawning aggregations (Union River and Big/Little Quilcene River) displayed positive growth rates over longer time scales (1970s – 2002) (Table 6). The latter two are both constituents of the Hood Canal genetically independent population (Sands et al. 2009), and experienced declines in the 1980- 1990s followed by recent increases (Sands et al. 2009)(Figure 4).
Table 6. Mean abundance of Hood Canal summer chum in each watershed and long-term (1970s – 2002) and short-term (1999 - 2002) population growth trends (NOAA Salmon Recovery Plan 2007).
| Population | Geometric mean escapement (1999-2002) | Long Term Trend (a value of 1.0 indicates that the population is replacing itself) | Short Term Trend |
| Union River | 594 | 1.08 | 1.10 |
| Lilliwaup Creek | 13 | 0.88 | 1.00* |
| Hamma Hamma River | 558 | 0.90 | 1.20 |
| Duckabush River | 382 | 0.91 | 1.14 |
| Dosewallips River | 919 | 0.96 | 1.25 |
| Big/Little Quilcene River | 4,512 | 1.05 | 1.62 |
| Snow/Salmon Creeks | 1,521 | 0.99 | 1.24 |
| Jimmycomelately Creek | 10 | 0.88 | 0.82* |
| *Supplementation programs at Jimmycomelately and Lilliwaup reduced the number of spawners released to achieve escapement naturally. | |||
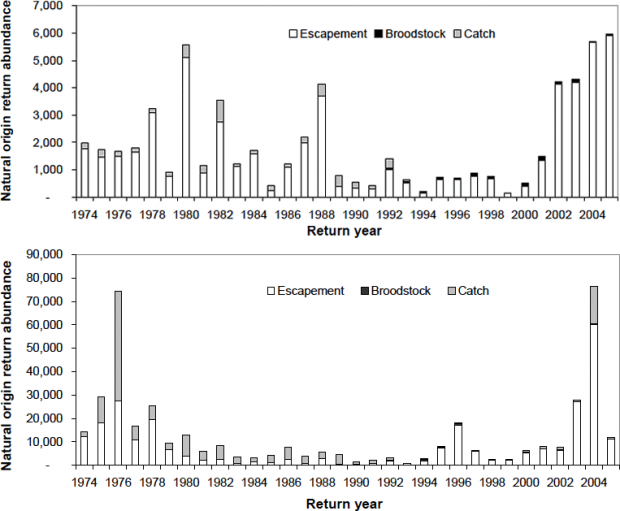
Figure 4. Annual return abundances of natural-origin summer chum salmon of the Strait of Juan de Fuca region (TOP) and the Hood Canal region (BOTTOM) from 1974 – 2005 (Reprinted from Sands et al. 2009; courtesy of NOAA Fisheries).
Steelhead Analyses utilizing all years of available data (ca. 1980 – 2004) and the 10 most recent years (1995-2004) indicated that most Puget Sound steelhead populations exhibited significantly declining trends in natural escapements, particularly in the southern Puget Sound (e.g., the Cedar, Lake Washington, Nisqually and Puyallup winter run populations) (Hard et al. 2007)(Table 7). Increasing populations were observed in the Samish and Hamma Hamma winter run populations (Hard et al. 2007)(Table 7).
Table 7. Estimates of temporal trends in escapement (E) and total run size(R) (log-transformed) for naturally produced Puget Sound. Positive values indicate a growing population, negative values indicate a declining one. Asterices indicate level of significance (Hard et al. 2007).
| Region | Run type | Population | E, all years | E, 10 years | R, all years | R, 10 years |
| NPSa | SSHb | Canyon | N/Ac | N/A | N/A | N/A |
| NPS | SSH | Skagit | N/A | N/A | N/A | N/A |
| NPS | SSH | Snohomish | N/A | N/A | N/A | N/A |
| NPS | SSH | Stillaguamish | N/A | N/A | N/A | N/A |
| NPS | WSHd | Canyon | N/A | N/A | N/A | N/A |
| NPS | WSH | Dakota | N/A | N/A | N/A | N/A |
| NPS | WSH | Nooksack | N/A | N/A | N/A | N/A |
| NPS | WSH | Samish | +0.067** | +0.061** | +0.019 | +0.014 |
| NPS | WSH | Skagit | -0.002 | -0.010 | -0.021 | -0.056 |
| NPS | WSH | Snohomish | -0.019 | +0.035* | -0.086 | N/A |
| NPS | WSH | Stillaguamish | -0.065**** | N/A | -0.110* | N/A |
| NPS | SSH | Tolt | +0.025 | +0.034 | -0.107 | -0.021 |
| SPSe | SSH | Green | N/A | N/A | N/A | N/A |
| SPS | WSH | Cedar | -0.179** | N/A | -0.299* | N/A |
| SPS | WSH | Green | +0.008 | -0.016** | -0.048 | -0.069* |
| SPS | WSH | Lk. Washington | -0.180 | -0.215**** | -0.300* | -0.274 |
| SPS | WSH | Nisqually | -0.084**** | -0.147**** | -0.097 | -0.159** |
| SPS | WSH | Puyallup | -0.062**** | -0.074**** | -0.103** | -0.103** |
| HCf | WSH | Dewatto | N/A | N/A | N/A | N/A |
| HC | WSH | Dosewallips | N/A | N/A | N/A | N/A |
| HC | WSH | Duckabush | +0.017 | -0.018 | +0.017 | -0.019 |
| HC | WSH | Hamma Hamma | +0.291* | +0.264 | +0.291* | +0.264 |
| HC | WSH | Quilcene | -0.006 | N/A | -0.006 | N/A |
| HC | WSH | Skokomish | -0.075**** | -0.136** | -0.109* | -0.136** |
| HC | WSH | Tahuya | +0.009 | -0.002 | +0.004 | -0.021 |
| HC | WSH | Union | +0.008 | +0.002 | +0.008 | +0.002 |
| SJFg | SSH | Elwha | N/A | N/A | N/A | N/A |
| SJF | WSH | Dungeness | -0.076**** | -0.093** | -0.083 | -0.093 |
| SJF | WSH | Elwha | N/A | N/A | N/A | N/A |
| SJF | WSH | McDonald | -0.031 | +0.009 | -0.362** | -0.221* |
| SJF | WSH | Morse | -0.006 | -0.015 | -0.030 | -0.050 |
aNPS=Northern Puget Sound
bSSH=Summer run steelhead
cN/A=Data not available
dWSH=Winter run steelhead
eSPS=Southern Puget Sound
fHC=Hood Canal
gSJF=Strait of Juan de Fuca
Bull trout
There is a paucity of reported data on the population trends of bull trout in Puget Sound.
Uncertainties
Because of the wide array of life history types exhibited and habitats utilized by salmonids, the list of human threats as well as environmental and ecological drivers of salmonid abundance is long. These include hydropower, harvest, reduction in freshwater habitat quality and quantity, interactions with other fish, birds and marine mammals, ocean conditions and negative impacts of hatchery-reared salmon (Ruckelshaus et al. 2002). These drivers likely apply to both listed and non-listed salmonids in Puget Sound.
Summary
Salmon and trout are key ecological, cultural and economic components of the Puget Sound ecosystem. The number of Chinook salmon has increased since being listed in 1999, although population numbers remain well below target abundances. Hood Canal Summer chum salmon populations have shown some increases since their listing. Population abundance data for the two listed trout and charr species have not been published in citable reports or other publications.
Literature Cited
Beechie, T., E. Buhle, M. Ruckelshaus, A. Fullerton, and L. Holsinger. 2006. Hydrologic regime and the conservation of salmon life history diversity. Biological Conservation 130:560-572.
Fresh, K. L. 2006. Juvenile Pacific salmon and the nearshore ecosystem of Puget Sound., Published by Seattle Districut, U.S Army Corps. of Engineeers, Seattle, WA.
Hard, J. J., J. M. Myers, M. J. Ford, R. G. Cope, G. R. Pess, R. S. Waples, G. A. Winans, B. A. Berejikian, F. W. Waknitz, P. B. Adams, P. A. Bisson, D. E. Campton, and R. R. Reisenbichler. 2007. Status review of Puget Sound steelhead (Oncorhynchus mykiss). U.S. Department of Commerce, NOAA Tech Memo, Seattle, WA.
NOAA. 2007. Puget Sound Salmon Recovery Plan. Shared Strategy for Puget Sound and NOAA Fisheries, Seattle, WA.
O'Neill, S. M., and J. E. West. 2009. Marine distribution, life history traits, and the accumulation of polychlorinated biphenyls in chinook salmon from Puget Sound, Washington. Transactions of the American Fisheries Society 138:616-632.
Quinn, T. P. 2005. The behavior and ecology of Pacific salmon and trout. American Fisheries Society, Bethesda, Md.
Quinn, T. P., B. R. Dickerson, and L. A. Vøllestad. 2005. Marine survival and distribution patterns of two Puget Sound hatchery populations of coho (Oncorhynchus kisutch) and chinook (Oncorhynchus tshawytscha) salmon. Fisheries Research 76:209-220.
Ruckelshaus, M. H., P. Levin, J. B. Johnson, and P. M. Kareiva. 2002. The Pacific salmon wars: What science brings to the challenge of recovering species. Annual Review of Ecology and Systematics 33:665-706.
Sands, N. J., K. Rawson, K. P. Currens, W. H. Graeber, M. H. Ruckelshaus, R. R. Fuerstenberg, and J. B. Scott. 2009. Determination of independent populations and viability criteria for the Hood Canal summer chum salmon evolutionarily significant unit. U.S. Department of Commerce, NOAA Fisheries, Seattle, WA.
WDFW. 2002. 2002 SaSI Introduction. Washington Department of Fish and Wildlife, Olympia, WA.


