

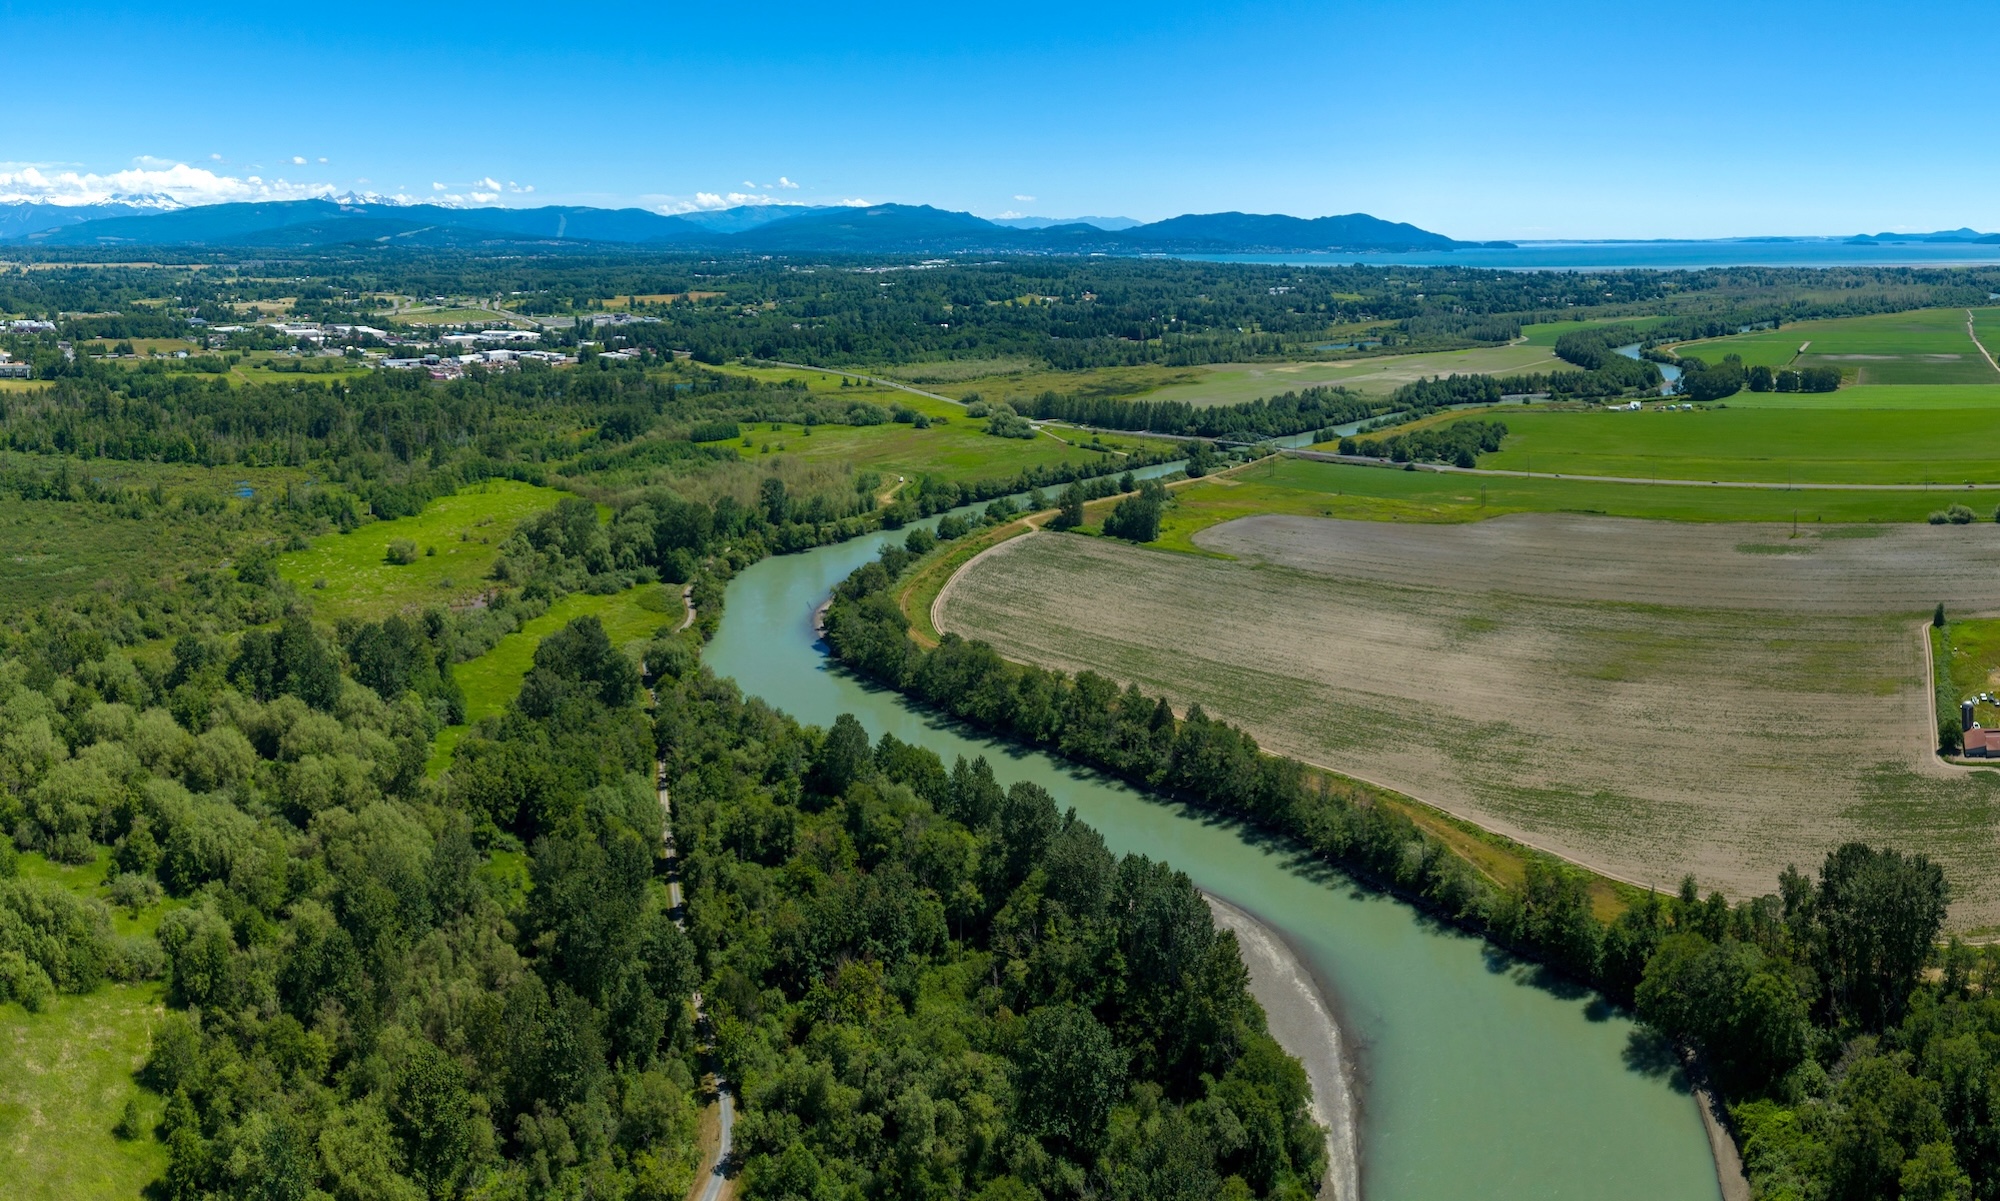
One Saturday afternoon this past April, a small group of local landowners gathered beside a creek at the edge of a small farm outside Maple Falls, Washington. Light blue tree sleeves dotted the landscape, covering thousands of new seedlings and shrubs that had been planted with funding from Washington State’s Riparian Grant Program the previous year.
The event was a Working Lands, Healthy Streams Open House organized by the Whatcom Conservation District, and attendees were getting a peek at one of the growing fields, quite literally, in streamside restoration and pollution control. The native trees and shrubs planted here at Empyrean Farm, would serve as what conservationists call a riparian buffer, a strip of vegetation designed to protect the stream and potentially Puget Sound creatures as well.
The new buffer covers 6.2 acres along 3,150 feet of Kendall Creek and one of its smaller tributaries. Kendall Creek is a fish-bearing stream that joins the North Fork of the Nooksack River at the site of a salmon hatchery about a quarter-mile downstream. The creek is also prone to flooding, the farm's owner Eliza Steele explained in a blog post profiling the project. The floods disrupt operations of the farm where Steele and her partner, Jeremy Dehnert, grow farm-stand vegetables and raise horses, sheep, and chickens.
As the salmonberry, red elderberry, Pacific crabapple, western red cedar, and dozen-and-a-half other species that make up the riparian buffer grow in over the coming years, their deep root network will dampen flooding from the creek. They will provide much-needed shade to a stretch of water where high temperatures have been identified as a threat to what is otherwise prime habitat for coho salmon, pink salmon, and steelhead trout.
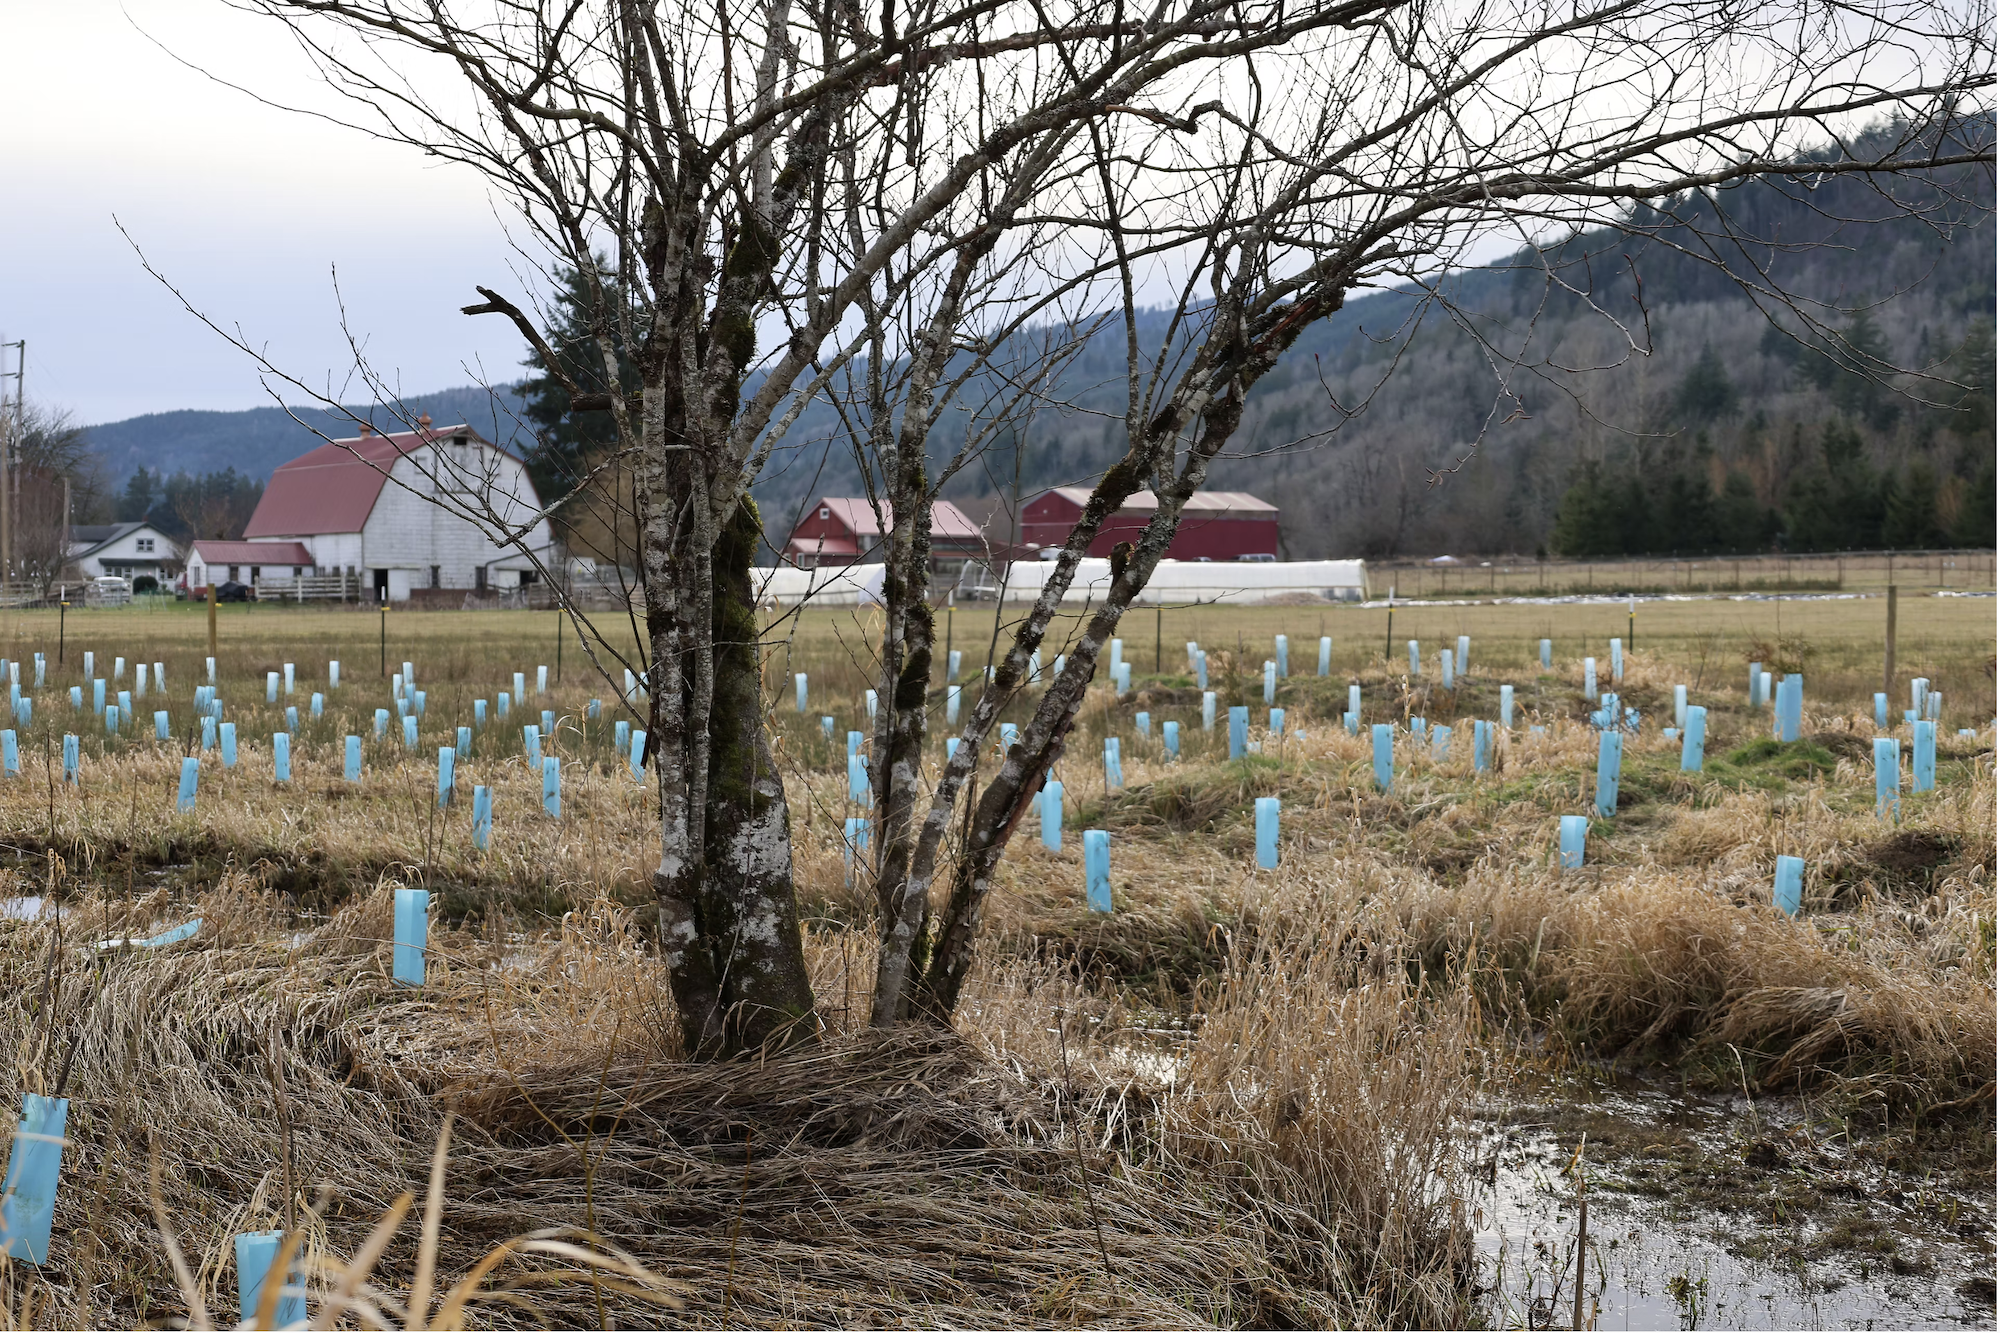
Riparian buffers are also a key technique to soak up excess nutrients, chiefly nitrogen and phosphorus, from agricultural runoff, preventing them from contributing to low-oxygen conditions downstream in Puget Sound. (Nutrient runoff has not been identified as a problem at Empyrean Farm, but agricultural runoff is a major source of nitrogen entering Puget Sound from the Nooksack River basin as a whole.)
Riparian buffers and other so-called best management practices (BMPs) for ensuring water quality of streams and rivers that drain agricultural lands are likely to be an increasing focus in the coming years, as the Washington State Department of Ecology finalizes and then implements its Puget Sound Nutrient Reduction Plan, released in draft form in June 2025. The plan calls for substantial reductions of nutrients in the 163 distinct watersheds that drain into the eight basins that make up Puget Sound.
Many practices that benefit agriculture can also improve water quality, says Corina Cheever, conservation planning manager at Whatcom Conservation District. Win-win solutions include not just flood-moderating riparian buffers like the one at Empyrean Farm but also manure management and pasture improvement projects. “Being able to connect with people about their land and their animals is how you reach that benefit,” Cheever says.
This article was funded in part by King County in conjunction with a series of online workshops exploring Puget Sound water quality.
But controlling so-called non-point-source nutrients, which come from diffuse runoff across the landscape rather than out of the end of a discrete pipe, is a delicate balance. Implementing BMPs requires time, effort, and monetary investment by already stretched-thin landowners. It puts two broad societal goals – ensuring clean water and protecting working lands – in tension, says Christopher Wally Wright, an environmental policy analyst at the Puget Sound Institute. Ecosystem recovery practitioners “want them to meet clean water standards,” he says of agricultural and forest landowners. “But we don't want them to be forced to do things that would then lead to a cease of operations.” [The Puget Sound Institute is the publisher of the Encyclopedia of Puget Sound.]
The Puget Sound Partnership’s 2026-2030 Action Agenda for Puget Sound recovery recognizes that tension. It includes, for the first time, items on controlling runoff from agricultural lands and forest roads – in addition to a more longstanding focus on protecting agricultural and working forest landscapes. As Ecology’s Puget Sound Nutrient Reduction Plan moves forward, the power of riparian buffers and other BMPs to achieve the necessary balance to meet all of those goals will be put to the test.
Sources of the problem
The overwhelming majority of nitrogen in Puget Sound – about 87% – comes from the ocean. About 3% is from natural sources within the surrounding watersheds, and 1% comes from atmospheric deposition. That means about 9% of the nitrogen entering Puget Sound is due to human activities.
Excess nitrogen in marine waters can promote blooms of phytoplankton which then die, sink to the bottom, and are consumed by bacteria in a process that uses oxygen – exacerbating Puget Sound’s natural tendency toward low oxygen especially in deeper waters. The question has been whether this addition of anthropogenic nutrients, although relatively small proportionally, is enough to tip the ecosystem over the edge and cause deoxygenation that local marine life isn’t adapted to – and what to do about it.
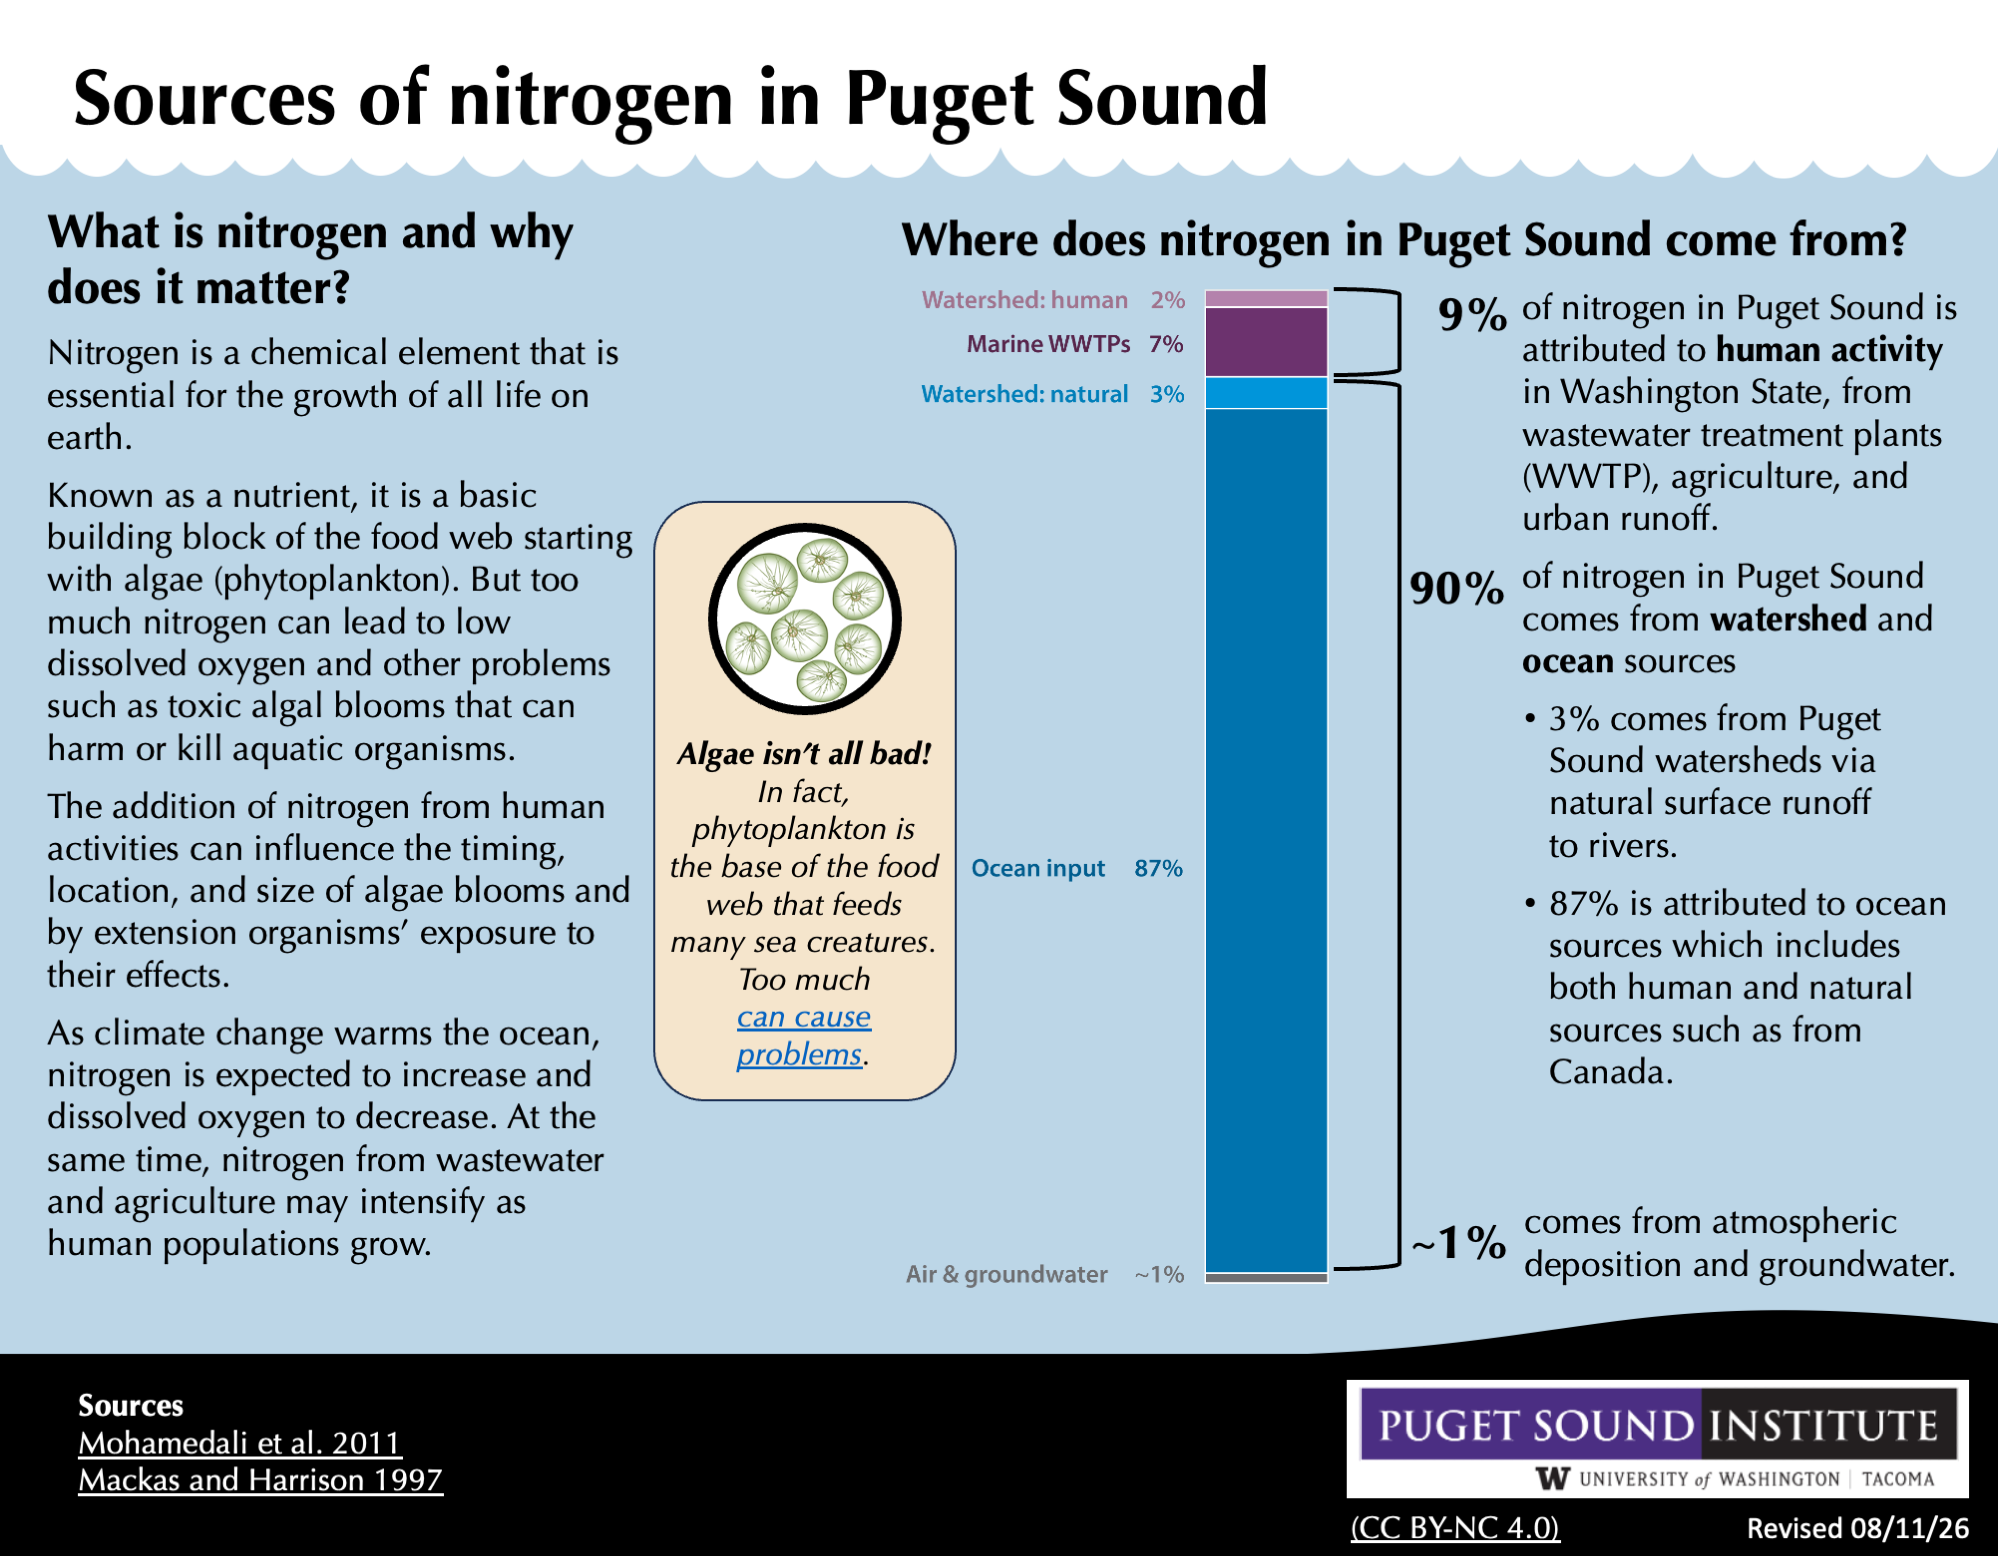
Until now, most of the public debate about reducing anthropogenic nutrients entering Puget Sound has focused on the 58 wastewater treatment plants that discharge effluent directly into marine waters. These account for about two-thirds of anthropogenic nitrogen entering Puget Sound and represent discrete, end-of-pipe, point-source nutrients.
The remaining one-third of anthropogenic nutrients come from surrounding watersheds and are transported to Puget Sound by rivers and streams. These watershed nutrients come from a mix of point sources – wastewater treatment plants and industry within watersheds – and non-point sources.
The non-point sources are not only diffuse but diverse: stormwater runoff from urban and suburban development, nutrients percolating through the ground from poorly maintained septic systems, pet waste, runoff from forest roads, tree plantations that are treated with biosolids fertilizer, fertilizer and manure from farms, and so on.
At issue in watersheds is not just nitrogen but also phosphorus, which contributes indirectly to deoxygenation in Puget Sound. Excess phosphorus can trigger blooms of freshwater algae; when the dead algae are transported downstream to Puget Sound the decomposition of this and other organic detritus can lower oxygen levels.
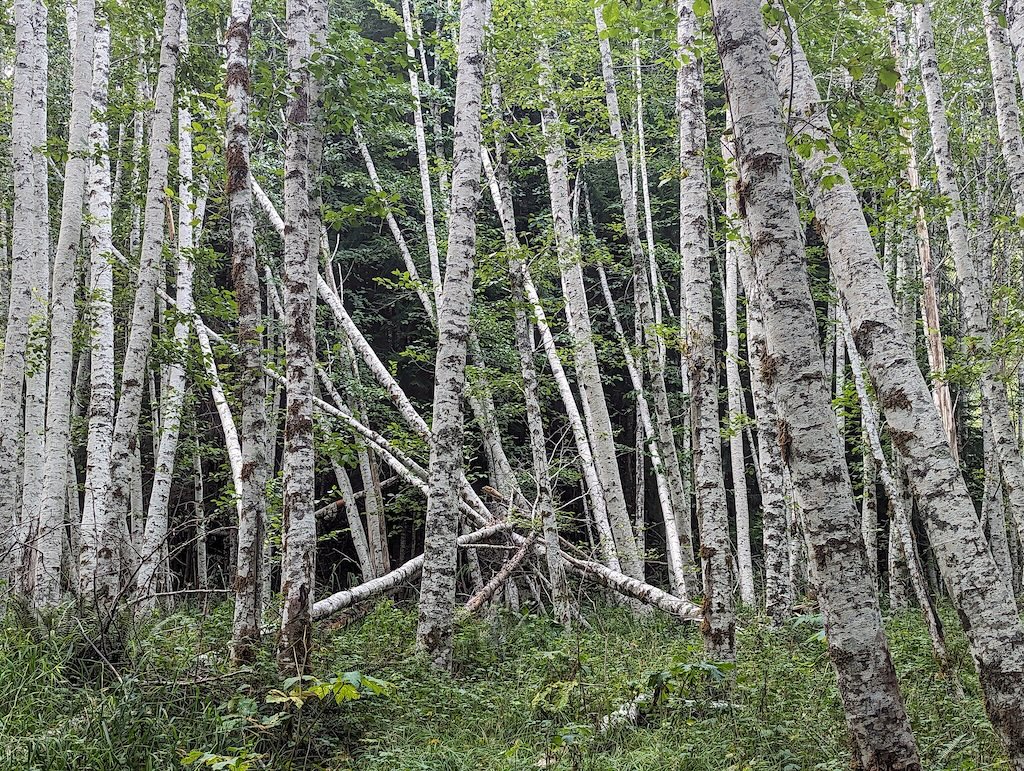
Studies of the different atomic forms, or isotopes, of nitrogen suggest that a substantial proportion of nitrogen in some watersheds comes from red alders (Alnus rubra), trees that host symbiotic bacteria in their root systems that fix nitrogen from the atmosphere. Red alders are native to the Puget Sound region, but since they are among the first trees to grow back after forest disturbance, they have become much more prevalent since European settlement brought large-scale logging to the watersheds around Puget Sound. At first glance they may seem like a natural source, but in fact in large part the nitrogen they contribute to watersheds is a result of human activities.
The targets
The underpinning of the Puget Sound Nutrient Reduction Plan is a series of exercises conducted since 2019 using the Salish Sea Model, a computer model that has been used to estimate the amount of nutrients discharging from the mouths of streams and rivers that empty into Puget Sound, and how those amounts have increased since European settlement.
As part of the plan’s development, Ecology analyzed different combinations of marine wastewater treatment plant and watershed nutrient reductions that would, according to the model’s predictions, reduce the number of days different parts of Puget Sound are likely to experience low-oxygen conditions.
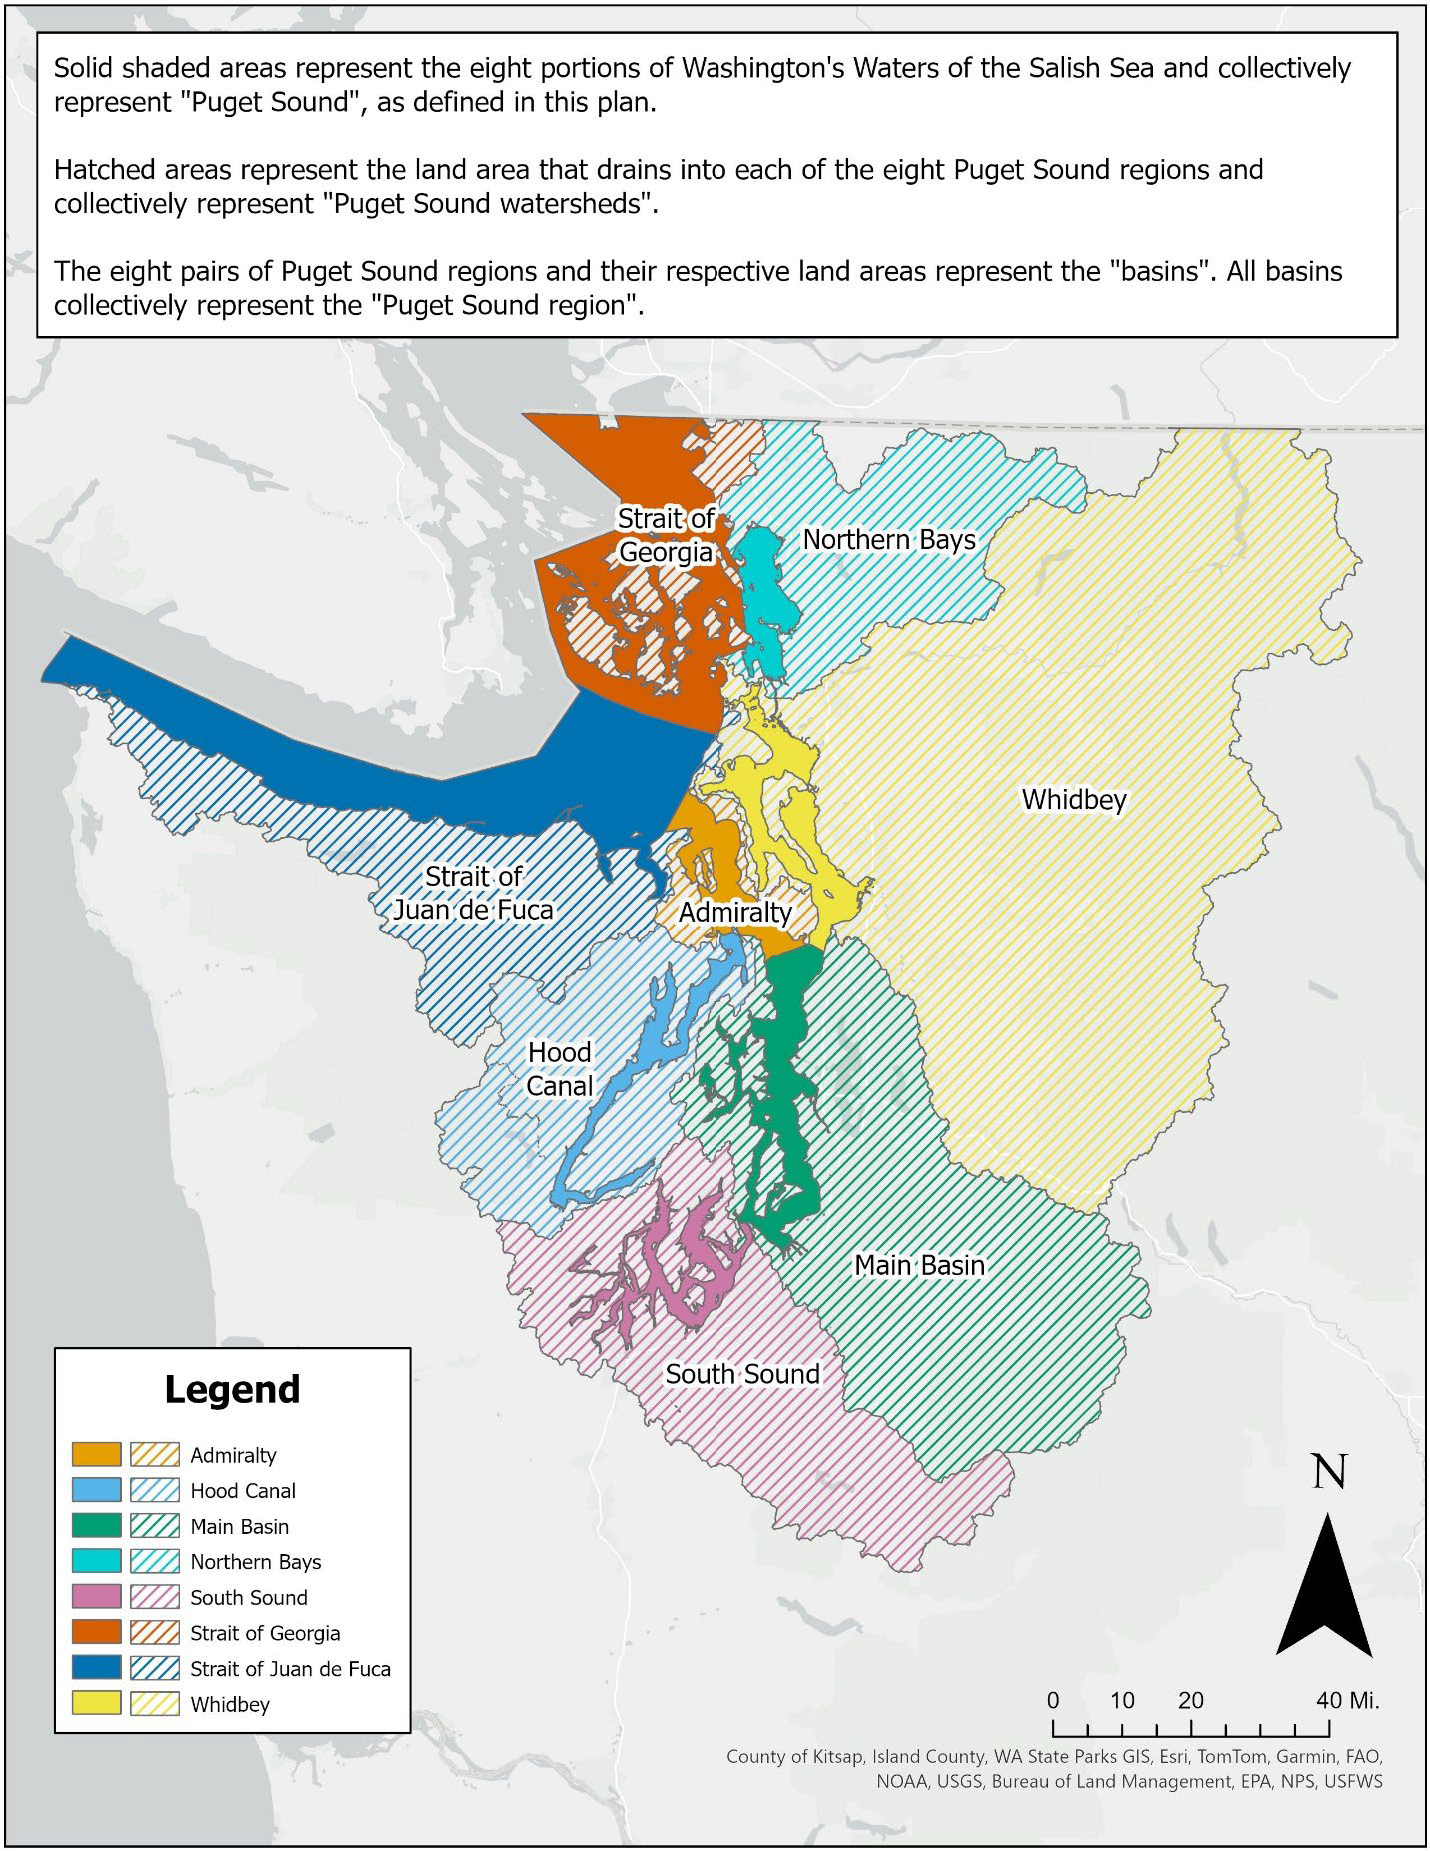
The plan calls for reducing anthropogenic nitrogen and organic carbon (reflecting that downstream-carried detritus) by 67.7% in the large watersheds feeding into the Northern Bays, Whidbey Basin, Main Basin, and South Sound. “Large watersheds” are defined as those with an average daily anthropogenic total nitrogen load greater than 1,000 kilograms per day.
Most other watersheds draining into the above four basins will need to reduce the anthropogenic nutrients they deliver to Puget Sound by 61.2%.
Nutrient reductions of 90% are called for in watersheds that feed into areas where low-oxygen problems have been particularly prominent: Sinclair Inlet and Liberty Bay in Main Basin; Carr and Henderson Inlets in South Sound; and Lynch Cove in Hood Canal.
The remainder of Hood Canal watersheds will need to reduce anthropogenic nutrients by 53.4%, as will the waterways that feed into Admiralty Inlet. No reductions are required for the streams and rivers that enter the Strait of Juan de Fuca and Strait of Georgia.
The watershed targets refer to reductions in the amount of nutrients coming out of the mouths of rivers, says Hannah Coe, Ecology's Nonpoint Policy Lead. “The draft plan currently has some bubble allocations for those watersheds, but it doesn't really get into the specifics within those watersheds,” she says.
Within each watershed, the overall nutrient reduction target will need to be met by some combination of point and non-point source reduction. How much and how to reduce each will be the subject of future modeling efforts in the next phase of the Plan’s development.
“That draft plan and those targets within it are on hold as we're looking to do more engagement [with stakeholders] and take a pause before any forward movement,” Coe reports. Once that next phase begins, the work will shift to developing watershed-specific plans, and “non-point will be a larger focus,” she says.
The draft plan calls for the agency to begin working on cleanup plans for two watersheds by 2027. The agency has begun initial planning for the next phase of the work, but does not yet have a timeline for implementing the document.
Modeling the problem areas
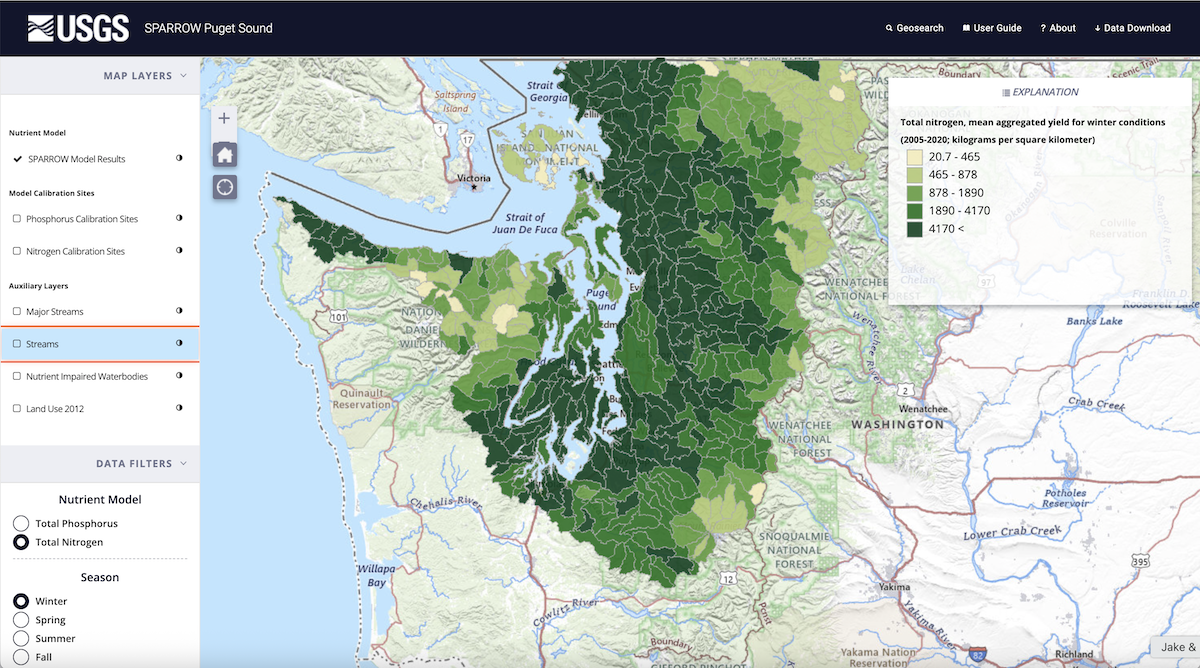
Some of the most detailed information available disaggregating the different sources of nitrogen and phosphorus in Puget Sound watersheds comes from a U.S. Geological Survey model known as SPARROW (SPAtially Referenced Regressions On Watershed attributes). A preliminary analysis of 19 major watersheds completed last year shows that the amounts and sources of nutrients vary in each watershed and across seasons.
The USGS modelers found that nitrogen coming out of the Nooksack River watershed, where Empyrean Farm is located, is dominated by nutrients from fertilizer, livestock manure, and alder trees, reflecting the watershed’s rural, agricultural character.
“I think that's exactly why we turn to a model like SPARROW is [because] we can say something about what is the contribution from point versus non-point” sources of nutrients, says USGS hydrologist Noah Schmadel.
The Nooksack is one of the four largest watershed sources of nitrogen to Puget Sound, according to the SPARROW results. The other three are the Cedar-Sammamish, Duwamish-Green, and Snohomish Rivers. Together the four contribute about half of the total watershed nitrogen to Puget Sound, in roughly equal measure (that is, about 14% each).
However, the watershed totals in the SPARROW analysis include nutrients from wastewater treatment plants with marine outfalls, making it difficult to directly compare with the proposed watershed reductions in Ecology’s draft plan.
In the current analysis, nitrogen from the urban Cedar-Sammamish and Duwamish-Green watersheds is largely from point sources at wastewater treatment plants. The Snohomish River watershed contributes nitrogen mainly from wastewater treatment plants and red alder trees.
The region’s largest watershed by area, the Skagit-Samish, contributes the fifth largest total nitrogen load. Much of the nitrogen from this heavily forested watershed comes from red alder trees and atmospheric deposition of nitrogen-containing particles.
The top contributors of phosphorus to Puget Sound are the Snohomish, Skagit-Samish, Cedar-Sammamish and Duwamish-Green watersheds.
The SPARROW model specifies not just the volume of nutrients coming into Puget Sound but where and from what sources they originate. Despite the inclusion of nutrients from marine-outfall wastewater treatment plants, it is possible to segment the totals to look at nutrient loads and sources at different locations upstream.
“We just want a really fair accounting,” says Schmadel. Still, the accounting is “quite crude,” he notes. That is, the model can identify that septic systems are an important source of nitrogen from Kitsap Peninsula watersheds, for example, but not trace this to individual septic systems.
Throughout the 19 river systems and across the study period, which modeled the years from 2005 through 2020, nitrogen loads discharged into Puget Sound were consistently largest during the winter, followed by fall. A USGS interactive mapping tool enables users to explore where and when nitrogen and phosphorus inputs to Puget Sound are originating.
Schmadel and his team have been discussing with Ecology officials how to refine the way the SPARROW analysis deals with wastewater treatment plants that discharge into the marine environment, so that it is easier to make comparisons across SPARROW and Salish Sea Model results. They plan to begin this analysis in October and release updated results by next fall.
Current solutions
While modeling and planning is still in process, “we don't have to wait for these watershed plans to start doing that [nutrient reduction] work in watersheds,” Coe says. “We know what a lot of these non-point issues are, and we can be working to solve them.”
In February, Ecology finalized an update to its Water Quality Management Plan to Control Nonpoint Sources of Pollution, a document required by the Clean Water Act to secure federal government funding for non-point pollution cleanup. The document covers Washington State as a whole, not only the Puget Sound region.
The Nonpoint Plan details local, state, federal, and tribal regulations relevant to non-point source pollution control and includes a comprehensive directory of partnerships and financial incentive programs that provide support for non-point pollution reduction – initiatives like the grant program that supported the riparian buffer project at Empyrean Farm.
A major function of Whatcom and other conservation districts is to help connect landowners with these sources of support. Conservation districts, which arose during the Dust Bowl era, are county-level, non-regulatory agencies that help local landowners steward the health of the natural resources on their land, says Aneka Sweeney, education and outreach manager for Whatcom.
Along with the Nonpoint Plan, the Ecology released its Voluntary Clean Water Guidance for Agriculture, which details best management practices (BMPs) for both source control and treatment of non-point source pollution. The techniques address not just nutrients like nitrogen and phosphorus but also bacteria from animal waste, increased stream temperatures, and other types of non-point source pollution.
The BMPs in the document are largely familiar, says Whatcom Conservation District's Cheever. But this is part of the point: BMPs are, after all, practices with plenty of robust science behind them.
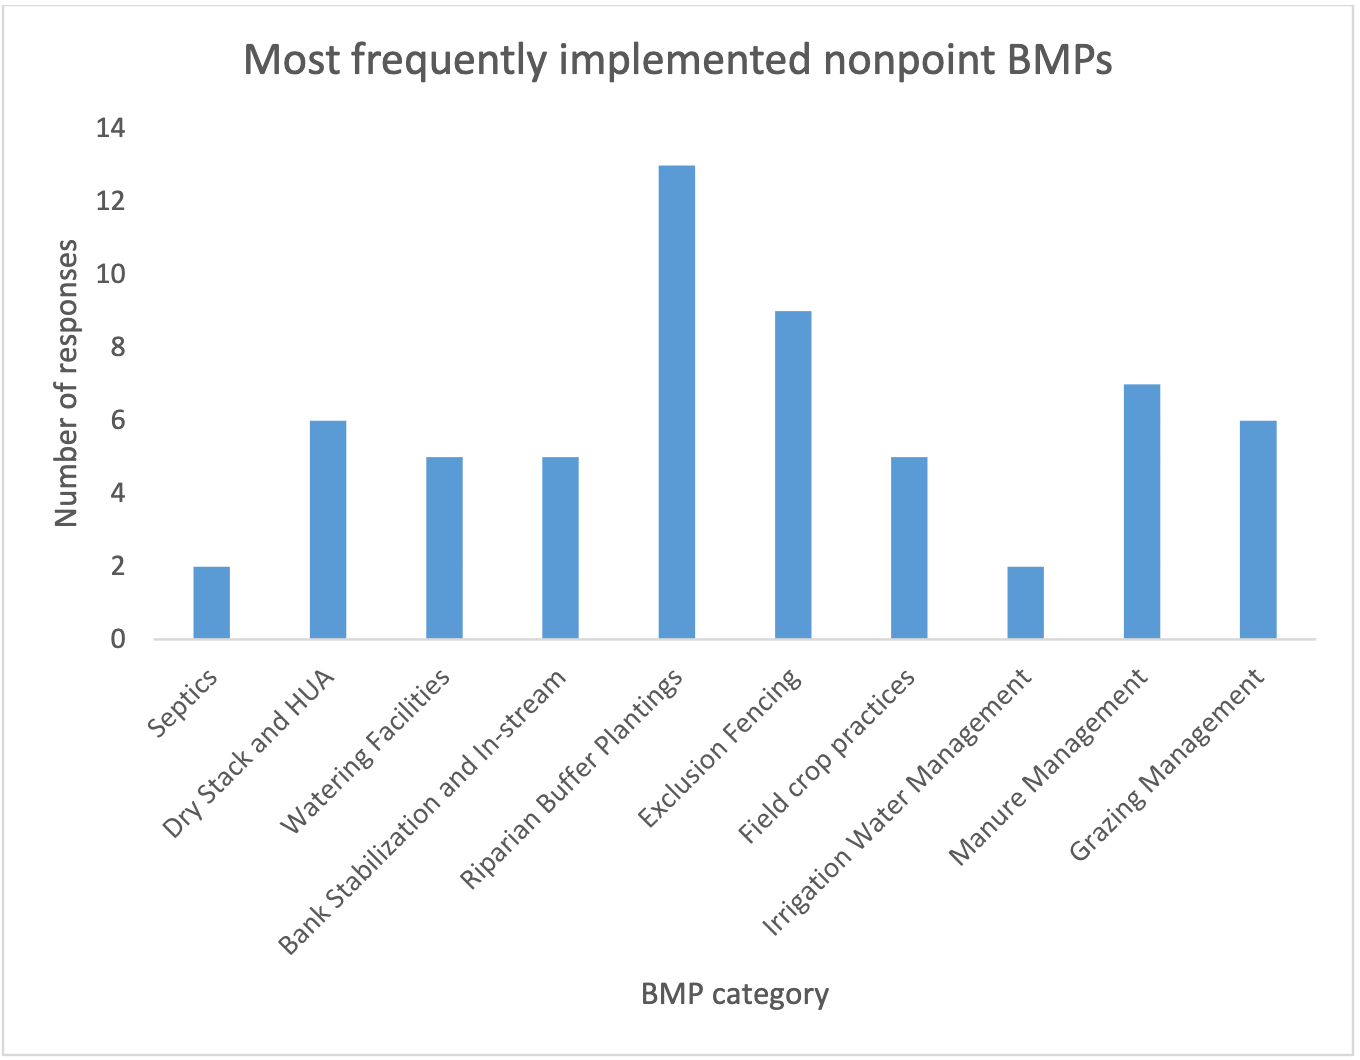
One innovation in the Voluntary Clean Water Guidance document is that the agency has grouped BMPs into “suites” of practices for different types of operations – such as livestock, row crop, and tree fruits – Coe says. “When landowners implement these groups of practices all together, it's expected that water quality will be fully protected,” she explains. This approach “provides assurances for those landowners” about actions they can take to avoid running afoul of Ecology's regulations.
Among the most important BMPs are riparian buffers. They “are really the big hitter of addressing non-point pollution holistically, and then also nutrients specifically,” Coe says, calling them “almost universally a great solution” for improving and ensuring water quality.
Similar to Ecology’s guidance for agricultural operations, the Washington Department of Natural Resources has a document that includes BMPs for reducing non-point source pollution on working forest lands.
Other approaches worldwide
Whether these approaches will be sufficient to reduce non-point source nutrients to the degree that is ultimately required remains to be seen. Not only are non-point source nutrients difficult to quantify and to trace to a specific source, but the effectiveness of efforts to control them can be equally tricky to confirm and quantify.
The experience in other estuaries that have faced – and continue to face – hypoxia linked to nutrient pollution shows how complex and fraught addressing non-point source nutrients can be. Denmark has been working to combat hypoxia in the waters along its Baltic Sea coastline since the 1980s. Initially the country achieved rapid reductions in nitrogen and phosphorus inputs by upgrading wastewater treatment plants, but “diffuse sources have been more of a longer haul. It doesn't come overnight," says Jacob Carstensen, a marine scientist at Aarhus University in Denmark.
After severe hypoxia events in coastal waters in 2023 and 2024, Denmark's government, agriculture industry, and environmental NGOs entered a "tripartite agreement" to make sweeping changes to land use across the country. The plan is to convert almost 400,000 hectares from agriculture to natural areas.
In the mid-1990s, strict limits on the country’s agriculture industry – which is focused on intensive hog farming and production of animal feed – came into force. Regulations limited the amount of fertilizer farmers could apply and the density of livestock they could keep, and water quality improved. This held for about two decades, until farmers began to complain of reduced protein content in their grain crops, and fertilizer restrictions were relaxed in 2016.
“We saw the effect of that in a few years after that,” Carstensen says. “We could see that nutrient inputs to coastal waters started to increase again."
In an analysis published earlier this year, Carstensen and his colleagues trace signs of eutrophication – nutrient-fueled algae growth that leads to deoxygenation – in 109 areas along the Danish coast from 1980 to 2023. Water quality improved between 1980 and the early 2000s, the analysis revealed, followed by stagnation and later reversal of some trends. “We've had effective nutrient management plans, but that didn't bring us to the end goal,” says Carstensen.
After severe hypoxia events in coastal waters in 2023 and 2024, Denmark's government, agriculture industry, and environmental NGOs entered a "tripartite agreement" to make sweeping changes to land use across the country. The plan is to convert almost 400,000 hectares from agriculture to natural areas – including 250,000 hectares of forest and 140,000 hectares of wetlands and meadows. The aim is to reduce eutrophication, protect and increase the carbon stores in low-lying lands, and safeguard biodiversity.
Modeling suggests that this shift will accomplish the additional 25% reductions in nitrogen inputs needed to control eutrophication, Carstensen says. But so far it is proving easier to secure transfers of the areas for wetland conversion, because these are marginal agricultural lands that are prone to flooding. The upland areas slated to become forests are more desirable for agriculture and more of a pinch point.
In the Chesapeake Bay region, there’s been a 40-year history of missing nutrient reduction deadlines. As in Denmark, reducing nutrients in wastewater treatment plant effluent, while initially thought to be forbiddingly complex and expensive, has actually proved easier to achieve than controlling non-point source nutrients, says Kurt Stephenson, a natural resource economist at Virginia Tech University in Blacksburg.
Computer models tend to overestimate the effectiveness of non-point source nutrient removal strategies. “It tends to be very hard to move the needle," Stephenson says. “You make progress, but the rate of progress is less than what you anticipate." In a paper published last year, Stephenson and his colleagues quantify this response gap and uncover some of the reasons behind it.
Implementing BMPs sometimes ends up simply shifting the nutrient burden, Stephenson says, with a farmer plowing in land elsewhere on the farm to make up for taking land out of production for a riparian buffer, for example. The ongoing intensification of agriculture in the Chesapeake Bay region is also an issue, creating what Stephenson explains is a mass balance problem with import of nutrients.
“Think of an area as a bathtub,” he says. “You're importing nitrogen into the system in the form of purchased fertilizer, but you're also importing nitrogen in the form of purchased feed.” That’s filling the bathtub. Export of meat, milk, or crops from the farm – all of which contain some amount of nitrogen – drains the tub. But in many places the tub is filling faster than it is draining.
In 2025, Virginia launched a Pay-for-Outcomes pilot program for its portion of the Chesapeake watershed. Rather than supporting landowners to implement BMPs, the state will pay them for improvements in the nutrient mass balance – regardless of whether it is achieved by reducing fertilizer application, replacing fertilizer with manure, keeping fewer livestock, or any other method.
Agriculture in Puget Sound watersheds is very diverse and often small scale – overall, much less intensive than in Denmark or the Chesapeake. In some ways that might make nutrient problems more manageable because there is less concentrated, large-scale import of nutrients. In other ways it makes addressing nutrients more complex because of the need for individually tailored solutions and the need to coordinate with a large number of landowners.
But the stakes of such efforts are much bigger than individual farms, ultimately touching every element of the Puget Sound ecosystem, from the most obscure to the most iconic. “The orcas will do better if you work on the salmon, and the salmon will do better if you work on the streams. The streams do better if you work on the runoff,” says the Puget Sound Institute's Wright. “So they're all connected."
This article was funded in part by King County in conjunction with a series of online workshops exploring Puget Sound water quality. Its content does not necessarily represent the views of King County or its employees.