

Background
Eutrophication of water bodies occurs when high levels of nutrients fuel high rates of primary production and accumulation of algal biomass, either as macroalgae or phytoplankton. Some ecosystems are naturally eutrophic, but in others human activity causes ecosystems to undergo transformations into a eutrophic state. This is termed cultural eutrophication, and is the primary concern in evaluating the status of marine waters of Puget Sound.
The primary cause of cultural eutrophication is human actions (e.g., land use, wastewater, agriculture) that increase the loadings of nutrients that limit algal growth (Carpenter et al. 1998). In Puget Sound (like many estuaries), dissolved inorganic nitrogen (DIN) is the primary limiting nutrient (Newton and Van Voorhis 2002). Research efforts have therefore focused on measuring the availability of DIN and on the rates of delivery from alternative sources. In general, DIN in Puget Sound can come from (1) the surrounding watershed via surface flow, groundwater, wastewater, and shallow septic systems; (2) recycling of nutrients from the sediments into the water column; (3) directly from the atmosphere; and (4) exchange with the coastal ocean. Human activity primarily affects watershed-based inputs, although climate change could alter delivery of nitrogen from coastal marine waters through its effects on coastal upwelling.
The vulnerability of an ecosystem to cultural eutrophication depends on several factors. Generally, strong vertical mixing can act to reduce the effects of nutrient enrichment via inducing light limitation on planktonic producers. Many areas of Puget Sound experience regular mixing through tidal exchange processes that could act to reduce the effects of anthropogenic DIN loading (Figure 1), but some are less well mixed and are therefore vulnerable to eutrophication. Such areas tend to be inlets with few freshwater inputs, and deep fjord-like basins that have limited exchange with surrounding waters (e.g., Hood Canal, South Puget Sound; Figure 1). A second major consideration is the extent to which primary production is already limited by DIN. This depends in large part on the availability of N from other sources: if DIN supply from other sources is relatively large, impacts of smaller additions of total N from anthropogenic sources may be relatively small. In Puget Sound, much of the DIN derives from exchange with coastal marine waters via exchanges in the Strait of Juan de Fuca and subsequently in the major sub-basins of Puget Sound (Mackas and Harrison 1997). A final consideration is the residence time of surface waters: if systems are rapidly flushed then surface waters containing anthropogenic DIN will be displaced quickly.

Figure 1. Sampling stations containing strong and persistent vertical stratification (red), based on WA Department of Ecology and PRISM data. Sites denoted by yellow and green are at lower risk of eutrophication. Reprinted from U.S. E.P.A. Region 10 Puget Sound Georgia Basin Ecosystem Indicators (for supporting references, see U.S. Environmental Protection Agency (2006).
In Puget Sound, the extent of DIN- limitation on algae varies strongly with space and time (Newton and Van Voorhis 2002) (Figure 2). In general, response of phytoplankton to nutrient enrichment is greatest during May – Aug. Nutrient responses in these months correspond to a drawing down of available DIN in the surface mixed layer during the spring, when phytoplankton production and standing stocks are the greatest (Newton and Van Voorhis 2002, Stark et al. 2008) (Figure 3a, 3b).
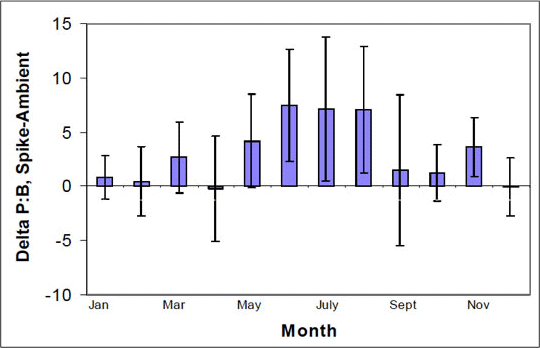
Figure 2. Change in phytoplankton production (production : biomass; PB) in response to nutrient spike. Bars represent averages taken over multiple sites. Nutrient limitation is greatest in May - August. Reprinted from Newton and Van Voorhis (2002) with permission from Washington Department of Ecology.
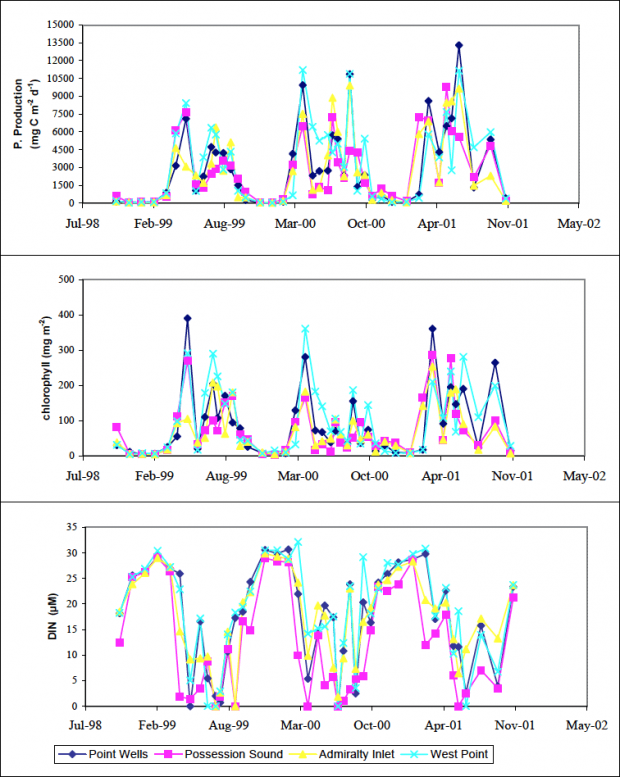
Figure 3a. Seasonal patterns of primary productivity, Chl.A and DIN at four sites, 1998 -2001. Reprinted from Newton and Van Voorhis (2002) with permission from Washington Department of Ecology.
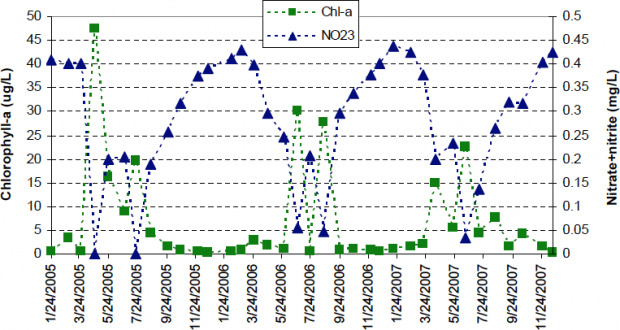
Figure 3b. Seasonal patterns of chlorophyll level and Nitrate/ Nitrite at Point Wells monitoring station, 2005-2007. Phytoplankton blooms are associated with a draw down of available DIN. Reprinted from Stark et al. (2008) with permission from King County Department of Natural Resources and Parks.
Monitoring Programs
Several entities conduct regular water quality monitoring within Puget Sound. The Washington State Department of Ecology conducts monthly sampling at several sites throughout Puget Sound (Figure 4). King County conducts monthly sampling at 14 offshore stations and 18 beach / nearshore stations in Central Puget Sound. The University of Washington PRISM program conducts biannual sampling at 39 stations throughout Puget Sound (Figure 5). The Hood Canal Dissolved Oxygen Program maintains 4 moorings that provide high-frequency monitoring of water quality conditions, and King County maintains three active moorings in central Puget Sound. Although the design of some of these monitoring programs have evolved over time to adapt to emerging issues, core sites have been maintained so that long-term trends can be evaluated(Newton et al. 2002). Detailed QA/ QC procedures for many of these programs are well documented (Washington State Department of Ecology 2006b, Albertson et al. 2007a).
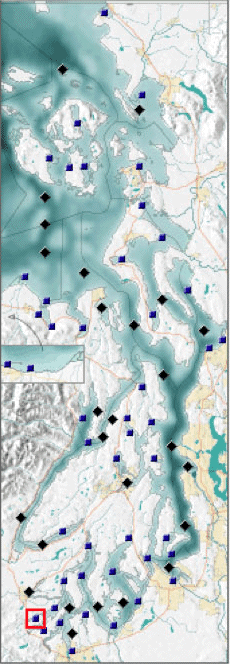
Figure 4. Location of Department of Ecology sampling sites. Used with permission from Department of Ecology.
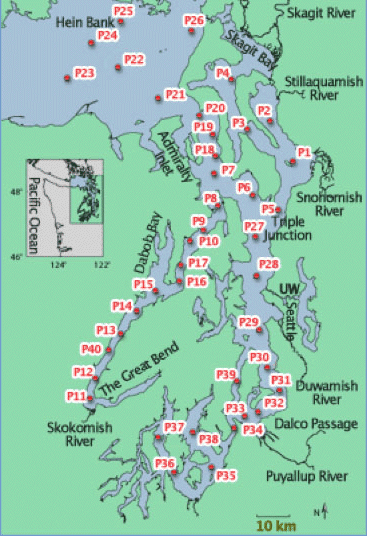
Figure 5. Location of PRISM sampling sites. Used with permission from University of Washington, publisher of web pages for Hood Canal Dissolved Oxygen Program.
Status and Trends
Several groups synthesize monitoring information to evaluate the status of eutrophic conditions throughout Puget Sound and in specific regions that are particularly vulnerable to eutrophication. King County uses a modified version of the Oregon Water Quality Index (Cude 2001) to combine information on dissolved oxygen, DIN and strength of vertical stratification to derive a single number that can be used to assess high to moderate eutrophication risk. In central Puget Sound, index values have been low since 2004 (the first year the index was calculated), except for 2007 when about 20% of the sampling sites showed moderate or high risk. We are unaware of any review process that evaluates the effectiveness of this modified index for predicting the onset of eutrophic conditions. The Department of Ecology published regular updates of their monitoring program up to 2002 (Newton et al. 2002) but no longer continues that reporting format. The Department of Ecology internet portal provides direct access to monitoring data and the results of a ranking algorithm by area for multiple water and sediment quality metrics (Washington State Department of Ecology 2006a).The most recent assessment year is 2008 and the 2010 assessment is scheduled to be complete by September 2010. Briefly, this index scores sample sites on a scale from 1 to 5. Scores of 1 to 3 indicate no water quality impairment, while scores of 4 and 5 indicated impairment. A score of 5 triggers action regarding Total Maximum Daily Loads. No synthetic analysis of the spatio-temporal extent of regions scoring 5 on this scale has been conducted, although the previous iteration of the Puget Sound Science Update reported DO levels at DOE monitoring stations that had very low (< 3 mg /l), low (2 mg /l = 5 mg / l ) and high (>5 mg /l) DO levels. In a review of estuarine conditions nationwide, Bricker et al. (2007) reported moderate to high levels of eutrophication in several regions of Puget Sound and high risk for worsening conditions in Hood Canal and South Puget Sound (Table 1). These rankings are based on surveys rather than an explicit and consistent data analysis effort. Albertson et al. (2002) demonstrated eutrophication symptoms in several regions throughout south Puget Sound (Figure 6). Eutrophication in southern Hood Canal has been well documented (Newton 2007) (see Dissolved Oxygen).
Table 1. Summary of current status, future outlook and status of influencing factors by location, From Bricker et al. 2007. Status levels and risk are assigned based on surveys of local experts, not on quantitatively defined categories.
| Influencing Factors | Eutrophic Conditions | Future Outlook (risk of worsening conditions) |
Central Puget Sound | Unknown | Moderate | Unknown |
South Puget Sound | Unknown | Moderate | High |
Skagit Bay / Whidbey Basin | Unknown | Moderate | Unknown |
Hood Canal | High | High | High |
Sequim / Discovery Bay | Unknown | Moderate / High | Unknown |
Port Orchard Sound | Unknown | Moderate | Unknown |

Figure 6. Summertime water clarity in South Puget Sound, 2006 – 2007. Dark points indicate sites with reduced frequencies of high water clarity. Reprinted from Albertson et al. (2002) with permission from Washington Department of Ecology.
Uncertainties
Ongoing research is working to develop detailed biophysical models of Puget Sound that will be useful for gauging the contributions of human activities to changes in trophic status of Puget Sound (Albertson et al. 2007b) and for identifying the most effective policy interventions to prevent worsening conditions. Our present understanding of the threats to Puget Sound is sufficient for identifying areas at risk of cultural eutrophication on the basis of stratification intensity and surface water residence time. We are aware that the Washington State Department of Ecology is presently developing a novel water quality index that may be effective in gauging the current water quality status throughout Puget Sound. Mapping this and other indices against the indicators used in NOAA’s national assessment may permit comparisons across ecosystems to better gauge the status of Puget Sound. Future eutrophication status may be affected by climate change through its effects on coastal upwelling intensity, ambient air temperature and timing of freshwater flows.
References
Albertson, S., J. Bos, K. Erickson, C. Maloy, G. Pelletier, and M. Roberts. 2007a. South Puget Sound Water Quality Study Phase 2: Dissolved Oxygen Quality Assurance Project Plan. Washington State Department of Ecology.
Albertson, S. L., J. Bos, G. Pelletier, and M. Roberts. 2007b. Estuarine flow in the south basin of Puget Sound and its effects on near-bottom dissolved oxygen. WA Department of Ecology, Olympia, WA.
Albertson, S. L., K. Erickson, J. A. Newton, G. Pelletier, R. A. Reynolds, and M. Roberts. 2002. South Puget Sound Water Quality Study Phase 1. WA Department of Ecology, Olympia, WA.
Bricker, S., B. Longstaff, W. Dennison, A. Jones, K. Boicourt, C. Wicks, and J. Woerner. 2007. Effects of nutrient enrichment in the nation's estuaries : a decade of change. National Centers for Coastal Ocean Science, Silver Spring MD.
Carpenter, S. R., N. F. Caraco, D. L. Correll, R. W. Howarth, A. N. Sharpley, and V. H. Smith. 1998. Nonpoint pollution of surface waters with phosphorus and nitrogen. Ecological Applications 8:559-568.
Cude, C. G. 2001. Oregon water qualit index: a tool for evaluating water quality management effectiveness. Journal fo the American Water Resources Association 37:125-137.
Mackas, D. L. and P. J. Harrison. 1997. Nitrogenous nutrient sources and sinks in the Juan de Fuca Strait / Strait of Georgia / Puget Sound Estuarine system: Assessing the potential for eutrophication. Estuarine, Coastal and Shelf Science 44:1-44.
Newton, J. 2007. Hood Canal: the complex factors causing low dissolved oxygen events require ongoing research, monitoring and modeling. Pages 95-96 in S. Bricker, B. Longstaff, W. Dennison, A. Jones, K. Boicourt, C. Wicks, and J. Woerner, editors. Effects of nutrient enrichment in the nation's estuaries : a decade of change. National Centers for Coastal Ocean Science, Silver Spring, MD.
Newton, J. and K. Van Voorhis. 2002. Seasonal patterns and controlling factors of primary production in Puget Sound's central basin and Possesion Sound. WA Department of Ecology, Olympia, WA.
Newton, J. A., S. L. Albertson, K. Van Voorhis, C. Maloy, and E. Siegel. 2002. Washington state marine water quality, 1998 through 2000. Washington State Department of Ecology, Olympia, WA.
Stark, K., S. Mickelson, and S. Keever. 2008. 2005 - 2007 Water Quality Status Report for Marine Waters. King County Department of Natural Resources and Parks, Seattle, WA.
U.S. Environmental Protection Agency. 2006. Puget Sound Georgia Basin ecosystem indicators report: technical background document. U.S. Environmental Protection Agency Region 10.
Washington State Department of Ecology. 2006a. Water Quality Program Policy: Assessment of water quality for the clean water act sections 303(d) and 305(b0 Integrated report. Washington State Department of Ecology, Olympia, WA.
Washington State Department of Ecology. 2006b. Water Quality Program Policy: Ensuring credible data for water quality management. Washington State Department of Ecology, Olympia, WA.


